Download Unicorn Signals App

By EquityPandit

Top Gainers

Why India Cement Share Soars 15.25%? What’s Technical Outlook?

India Cements Ltd

NSE :INDIACEM   BSE :530005  Sector : Cement

About Company: India Cements Ltd is a leading cement manufacturing company headquartered in Chennai. It was incorporated in the year 1946 by Shri S N N Sankaralinga Iyer and Sri T S Narayanaswami. While retaining cement over the years as its mainstay, India Cements has ventured into related fields like shipping, captive power and coal mining that have purposeful synergy to the core business. The co is also a sponsor of the IPL franchise “Chennai Super Kings

News in India Cement: Ace investor has raised stake in India Cements Ltd. from 20.73 per cent to 22.76 per cent. As per the latest communication by BSE, market magnet has bought 62,98,686 shares of India Cements, which is 2.03 per cent of the total issued paid up capital of the company. 

Weekly Chart of India Cement:

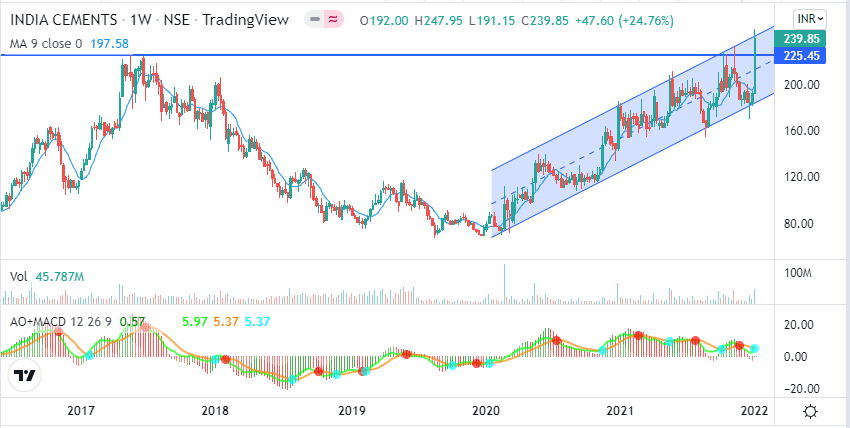
Technical Outlook of India Cement:

Stock on Friday 7th Jan hits 2 upper circuits and closed at 239.85 per share gaining 15.28%. Volumes were on the decent level. Fresh breakout is seen in the stock today on account of news of Ace investor Radha Krishanan Damani increased stake by 2.03 per cent in India Cement. On Weekly chart time frame as per price action 225 is the decent support level for the stock. Till stock holds above 225 one should keep strategy to buy stock on corrections. Stock is trading upward sloping channel pattern, as shown on the chart above.

As per the chart setup, news & momentum in India Cements, We recommend to buy stock on correction till 225 level for the target of 300 Stoploss should be kept below 200 level on closing basis.

Get Daily Prediction & Stocks Tips On Your Mobile


I would like to receive communication from EquityPandit via sms, email, whatsapp, Google RCS for offers, updates etc.
Top Gainers

Dr. Lal Pathlabs Stock Price gained 9.67% on Friday’s Trade. What’s Ahead ?

Prateek Gupta

Dr Lal Pathlabs Ltd

NSE :LALPATHLAB   BSE :539524  Sector : Healthcare

About Company: Dr. Lal PathLabs Limited is one of India’s leading consumer healthcare brand in diagnostic services. It has an integrated nationwide network, where patients and healthcare providers are offered a broad range of diagnostic and related healthcare tests and services for use in: core testing, patient diagnosis and the prevention, monitoring and treatment of disease and other health conditions. The services of DLPL are aimed at individual patients, hospitals and other healthcare providers and corporates

Daily Chart of Dr. Lal Pathlabs Ltd.

Daily Chart of LALPATHLAB

Technical Outlook of LALPATHLAB:

On Friday 27th May 2022, Stock zoomed and gained 10% closing at 2204.50 on NSE. On the daily chart rise in the volumes has been seen with the rise in prices of stock since last two trading sessions. “Falling Wedge pattern” formation is clearly visible. 14- Period Relative Strength Index (RSI) has seen moving average cross over which confirms bottom formation.

We suggest traders to buy stock on current levels around 2200- 2205 for the upside target of 2500- 2700, and Stop loss should be maintained below 1800 on closing basis.

Top Gainers

Hero MotoCorp Share Prices Gained 3.85% On Wednesday. What’s Ahead?

Prateek Gupta

Hero MotoCorp Ltd

NSE :HEROMOTOCO   BSE :500182  Sector : Automobile

About Company: Hero Moto Corp earlier also known as “Hero Honda” is one of India’s first motorcycle manufacturers. The company started in 1984 as a Technological collaboration with Honda, Japan. Before this collaboration, Hero was selling Cycles under the brand name, Hero Cycles. In 2011, Honda group sold its 26% stake in the company to the Munjals (promoters) and ended the JV. Post the termination of JV, the name of the company was changed to Hero Motocorp.

Daily Chart of Hero MotoCorp Ltd:

Technical Outlook of Hero MotoCorp Ltd:

On Wednesday 27th April 2022, Stock gained 3.85% in a weak market and stock was top gainer in the F&O Segment. Just a day before April 2022 series expiry huge short covering has been witnessed in the stock, With fresh longs added. If we look at the chart structure, the stock has formed a “Double Bottom Pattern” forming strong support at 2150.

For the further analysis we plotted Fibonacci Retrenchment on the previous trend and observed that stock has touched 50% Fibo level at 2510. Also today stock managed to close above 100 days exponential Moving average. The Relative Strength Index also gained momentum and closed above 60 mark.

Looking at the chart structure and rise in prices with volumes we expect further rally to be seen in the stock hence we recommend to enter the stock around current levels 2480- 2500 with stop loss placed below 2370 for the targets of 2594- 2716 in the next 1-2 Months. 

Top Gainers

Adani Ports Share Gained 5.81% on Tuesday’s Trade. What’s the Outlook?

Prateek Gupta

Adani Ports & Special Economic Zone Ltd

NSE :ADANIPORTS   BSE :532921  Sector : Infrastructure Developers & Operators

About Company: Adani Ports & Special Economic Zone is in the business of development, operations and maintenance of port infrastructure (port services and related infrastructure development) and has linked multi product Special Economic Zone (SEZ) and related infrastructure contiguous to Port at Mundra.

Daily Chart of Adani Ports:

Technical Outlook of Adani Ports Ltd:

On Tuesday, 26th April 2022 a clean breakout was seen in Adani ports daily chart. Stock gained momentum today and closed with the gains of 5.81%. Stock consolidated between 650 to 880 for almost 1.2 years. Finally the stock managed to close above the resistance level of 880 and closed above it, Now these levels would act as immediate support for the stock.

If we look at the Relative strength Index its trading above 70 level which indicates momentum in the stock. Also stock is trading above 20,50,100 & 200 Exponential Moving averages which is a bullish sign for the stock.

We suggest traders to hold long position in the stock and also one can initiate fresh long position in the stock near current market prices of 900-910 with stoploss placed below 815 and Targets on the upside are expected to be 1020- 1100 in the next 1-2 months

Top Gainers

AB Capital Share Gained 2.93% Today ? What’s Ahead ?

Prateek Gupta

Aditya Birla Capital Ltd

NSE :ABCAPITAL   BSE :540691  Sector : Finance

About Company: Aditya Birla Capital Limited (ABCL) is the holding company for the financial services businesses of the Aditya Birla Group. ABCL’s subsidiaries have a strong presence across Protecting, Investing and Financing solutions, ABCL is a universal financial solutions group catering to diverse needs of its customers across their life stages.  Powered by more than 30,000 employees, the subsidiaries of ABCL have a nationwide reach with 950 branches and more than 2,00,000 agents / channel partners and several bank partners.

As of December 31st, 2021, Aditya Birla Capital Limited manages aggregate assets under management over Rs. 3,724 billion, has a consolidated lending book of approx. Rs. 614 billion, and an active customer base of over 31 million, through its subsidiaries and joint ventures. Aditya Birla Capital Limited is a part of the Aditya Birla Group, in the league of Fortune 500. Anchored by an extraordinary force of over 140,000 employees, belonging to 100 nationalities. Today, over 50% of Group revenues flow from overseas operations that span 36 countries in North and South America, Africa and Asia.

Daily Chart of AB Capital:

Technical Outlook of AB Capital:

On Monday 25th April 2022 stock gained 2.93% and closed at 115.75. On the Daily Charts stock is consolidating and huge accumulation has been seen around support level of 96. On the upside 139 is the resistance of the stock. On the short term charts 4 Hourly stock is set to head towards higher levels of 139. Hence we recommend to buy and hold stock with stoploss of 95 for the targets of 139 in the next 1-2 Months.

Top Gainers

BSE Share Prices Zoomed 18.60% On Thursday Trade. What’s Next?

Prateek Gupta

BSE Ltd

NSE :BSE   BSE :538397  Sector : Miscellaneous

About Company: BSE is one of Indias leading exchange groups. Over the past 145 years, BSE has provided a capital-raising platform and provided a platform for trading in equity, debt instruments, derivatives and mutual funds. It also has a platform for trading in equities of small-and-medium enterprises (SME)

Daily Chart of BSE Limited:

Technical Outlook of BSE Limited:

On Thursday 10th March 2022 stock gained 18.60%, stock was up Rs.410.75 per share and closed at 2619.45 on National Stock Exchange. Today market traded volatile due to Election results of five states, Market opened Gap Up and sharp sell off was seen in the afternoon session. Nifty Touched intraday high of 16753 and drag towards intraday low of 16450. Fall of 303 points from Intraday highs.

On contrarian smart rally is seen in the BSE limited with huge volumes. On 23-March-2022, the Company will go through corporate event of Stock Split in ratio of 1:3. In The Daily chart, we can clearly observe range breakout. Stock is trading above 200-100-50-20 Exponential moving averages. Relative Strength Index crossed 70 market which suggest momentum in the stock.

Looking at the Chart structure, Range breakout and Indicator momentum, we suggest adding small quantity in portfolio for the targets of 3200- 3500+ in the next 3-6 months. Stop loss should be maintained below, 2100.

Latest
IPO
Weekly
Outlook

Stock
Market
Prediction