Bank Nifty Today
Explore On


Prev. Close
Open price
Today's Low / High
52 Week Low / High
Volume
Bid Price (qty)
Offer Price (qty)
Bank Nifty Chart
Returns
| 02 Feb 58619.00 (0.35%) | 01 Feb 58417.20 (-2.00%) | 30 Jan 59610.45 (-0.58%) | 29 Jan 59957.85 (0.60%) | 28 Jan 59598.80 (0.66%) | 27 Jan 59205.45 (1.25%) | 23 Jan 58473.10 (-1.23%) | 22 Jan 59200.10 (0.68%) | 21 Jan 58800.30 (-1.02%) | 20 Jan 59404.20 (-0.81%) | 19 Jan 59891.35 (-0.34%) | 16 Jan 60095.15 (0.86%) | 14 Jan 59580.15 (0.00%) | 13 Jan 59578.80 (0.22%) | 12 Jan 59450.50 (0.34%) | 09 Jan 59251.55 (-0.73%) | 08 Jan 59686.50 (-0.51%) | 07 Jan 59990.85 (-0.21%) | 06 Jan 60118.40 (0.12%) |
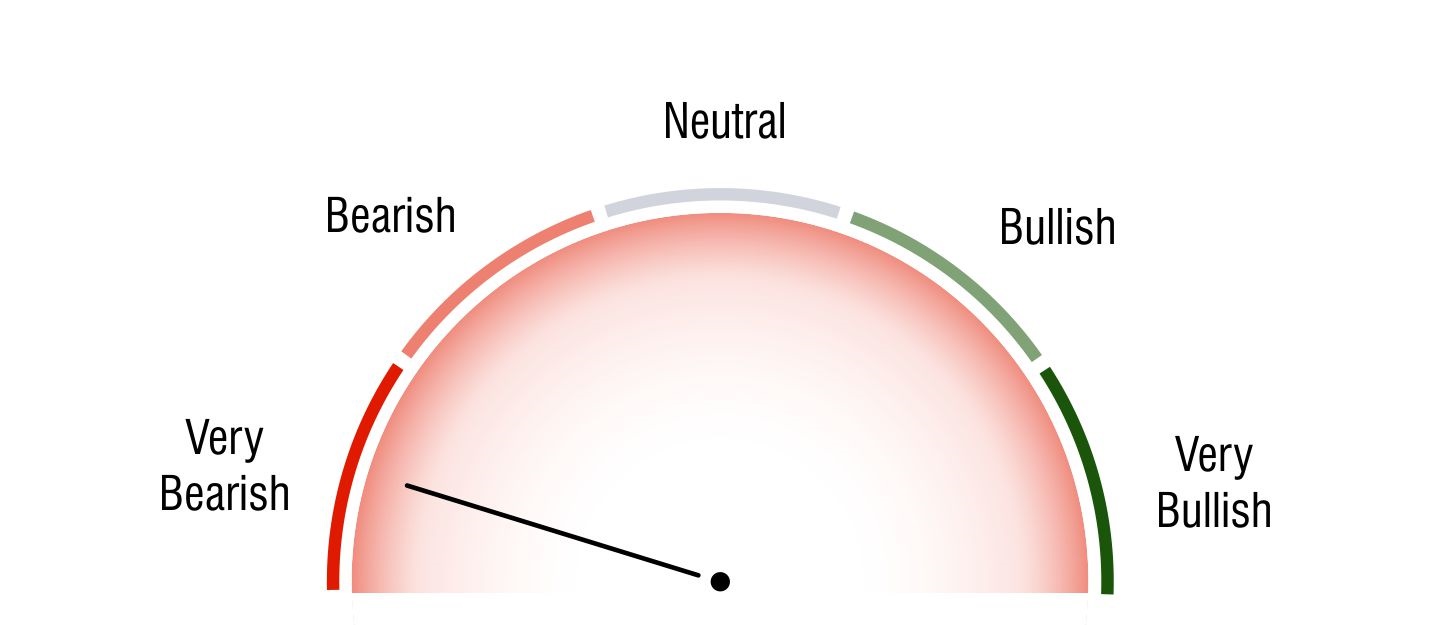
Bank Nifty Bullish / Bearish Zone
Technical Analysis
Short Term Investors

Very Bearish
Medium Term Investors

Neutral
Long Term Investors

Bullish
Moving Averages
5 DMA
Bearish59240.66
10 DMA
Bearish59128.65
20 DMA
Bearish59448.7
50 DMA
Bearish59353.15
100 DMA
Bullish58055.15
200 DMA
Bullish56859.77
Intraday Support and Resistance
(Based on Pivot Points) Updated On Feb 02, 2026 04:00 PM For Next Trading Session| Pivots | Classic | Fibonacci | Camarilla | Woodie | DM |
|---|---|---|---|---|---|
| R3 | 59784.61 | 59235.83 | 58854.73 | - | - |
| R2 | 59235.83 | 58908.38 | 58776.15 | 59295.93 | - |
| R1 | 58927.41 | 58706.08 | 58697.58 | 59047.61 | 59081.63 |
| P | 58378.63 | 58378.63 | 58378.63 | 58438.73 | 58455.74 |
| S1 | 58070.21 | 58051.18 | 58540.42 | 58190.41 | 58224.43 |
| S2 | 57521.43 | 57848.88 | 58461.85 | 57581.53 | - |
| S3 | 57213.01 | 57521.43 | 58383.27 | - | - |
Bank Nifty Stock List
Stuck on a Stock? Get clear short term view in seconds!
Just Ask The Analyst| Company Name | Price | Chg. | Market Cap (Cr) | 52 Week High | 52 Week Low | ROE | P/E | P/B | EBITDA |
|---|

