Download Unicorn Signals App

By EquityPandit

SUN PHARMA

Sun Pharma Outlook for the Week (September 28, 2015 – October 02, 2015)

EquityPandit’s Outlook for Sun Pharma for the week (September 28, 2015 – October 02, 2015):


SUN PHARMA:


SUNPHARMA


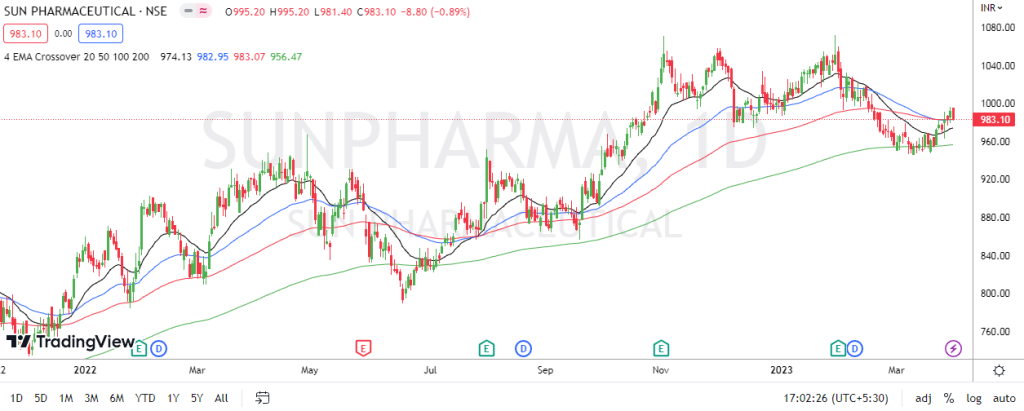
SUN PHARMA closed the week on negative note losing around 1.5%.

As we have mentioned last week that resistance for the stock lies in the range of 920 to 930. If the stock manages to close above the levels of 920 the stock can move to the levels of 960 from where the stock has retraced couple of times in last 2 months. The stock manages to hit a high of 913 during the week.

During the week the stock was trading in very tight range of 890 on lower end to 915 on upper end. A breakout on either side will move the stock further 2% to 4% in that direction.

Support for the stock lies in the zone of 860 to 880 where 100 Daily SMA and long term support trend-line are positioned. If the stock moves below this levels then the stock can drift to the levels of 810 where long term support for the stock is lying.

Resistance for the stock lies in the range of 910 to 920 where 200 Daily SMA is positioned. If the stock manages to close above the levels of 920 the stock can move to the levels of 960 from where the stock has retraced couple of times in last 2 months.

Broad range for the stock in the coming week can be 860 – 880 on lower side to 930 – 940 on upper side.

Get Daily Prediction & Stocks Tips On Your Mobile


I would like to receive communication from EquityPandit via sms, email, whatsapp, Google RCS for offers, updates etc.
SUN PHARMA

Sun Pharma Outlook for the Week (April 03, 2023 – April 07, 2023)

Prateek Gupta

Check SUNPHARMA Full Analysis At Unicorn Signals

SUNPHARMA Weekly Outlook and Analysis:

For the Week: (April 03, 2023 – April 07, 2023)

Sun Pharma Outlook for the Week (April 03, 2023 – April 07, 2023)

BSE: 524715| NSE: SUNPHARMA| ISIN: INE044A01036 | SECTOR: PHARMA

Stock closed the Weekly on positive note gaining 1.05%

Sun Pharma Share Price: 983.10

Weekly High: 996.50

Weekly Low:  963.00

Weekly Range: 10.25 Points

Weekly Support & Resistance For Sun Pharma:

RESISTANCE 21013
RESISTANCE 1998
SUPPORT 1965
SUPPORT 2947
Sun Pharma Outlook for the Week (April 03, 2023 – April 07, 2023)

Technically on the daily charts EquityPandit’s Analyst see: Minor support on the downside lies at 965 levels, Minor resistance on the upside is capped around 998 levels.

If stock breaches minor support on the downside and closes below it we may see fresh break down and stock can drag towards Major Support on lower side @ 947 and If stock breaches minor resistance on the upside and closes above it we may see fresh breakout and stock can head towards Major Resistances Level @ 1013

Stock is trading  above 200 days exponential moving average, suggests long term trend is bullish. EquityPandit predicts range for the Weekly as 1013 upside and 947 on downside.

SUN PHARMA

Sun Pharma Outlook for the Week (Mar 27, 2023 – March 31, 2023)

Prateek Gupta

Check SUNPHARMA Full Analysis At Unicorn Signals

SUNPHARMA Weekly Outlook and Analysis:

For the Week: (Mar 27, 2023 – March 31, 2023)

Sun Pharma Outlook for the Week (Mar 27, 2023 – March 31, 2023)

BSE: 524715| NSE: SUNPHARMA| ISIN: INE044A01036 | SECTOR: PHARMA

Stock closed the Weekly on positive note gaining 1.58%

Sun Pharma Share Price: 972.85

Weekly High: 382.95

Weekly Low:  347.35

Weekly Range: 15.15 Points

Weekly Support & Resistance For Sun Pharma:

RESISTANCE 21002
RESISTANCE 1987
SUPPORT 1952
SUPPORT 2932
Sun Pharma Outlook for the Week (Mar 27, 2023 – March 31, 2023)

Technically on the daily charts EquityPandit’s Analyst see: Minor support on the downside lies at 952 levels, Minor resistance on the upside is capped around 987 levels.

If stock breaches minor support on the downside and closes below it we may see fresh break down and stock can drag towards Major Support on lower side @ 932 and If stock breaches minor resistance on the upside and closes above it we may see fresh breakout and stock can head towards Major Resistances Level @ 1002

Stock is trading  above 200 days exponential moving average, suggests long term trend is bullish. EquityPandit predicts range for the Weekly as 1002 upside and 932 on downside.

SUN PHARMA

Sun Pharma Outlook for the Week (Mar 20, 2023 – March 24, 2023)

Prateek Gupta

Check SUNPHARMA Full Analysis At Unicorn Signals

SUNPHARMA Weekly Outlook and Analysis:

For the Week: (Mar 20, 2023 – March 24, 2023)

Sun Pharma Outlook for the Week (Mar 20, 2023 – March 24, 2023)

BSE: 524715| NSE: SUNPHARMA| ISIN: INE044A01036 | SECTOR: PHARMA

Stock closed the Weekly on positive note gaining 0.23%

Sun Pharma Share Price: 957.70

Weekly High: 970.00

Weekly Low:  947.55

Weekly Range: 2.15 Points

Weekly Support & Resistance For Sun Pharma:

RESISTANCE 2981
RESISTANCE 1969
SUPPORT 1946
SUPPORT 2935
Sun Pharma Outlook for the Week (Mar 20, 2023 – March 24, 2023)

Technically on the daily charts EquityPandit’s Analyst see: Minor support on the downside lies at 946 levels, Minor resistance on the upside is capped around 969 levels.

If stock breaches minor support on the downside and closes below it we may see fresh break down and stock can drag towards Major Support on lower side @ 935 and If stock breaches minor resistance on the upside and closes above it we may see fresh breakout and stock can head towards Major Resistances Level @ 981

Stock is trading  above 200 days exponential moving average, suggests long term trend is bullish. EquityPandit predicts range for the Weekly as 981 upside and 935 on downside.

SUN PHARMA

Sun Pharma Outlook for the Week (Mar 13, 2023 – March 17, 2023)

Prateek Gupta

Check SUNPHARMA Full Analysis At Unicorn Signals

SUNPHARMA Weekly Outlook and Analysis:

For the Week: (Mar 13, 2023 – March 17, 2023)

Sun Pharma Outlook for the Week (Mar 13, 2023 – March 17, 2023)

BSE: 524715| NSE: SUNPHARMA| ISIN: INE044A01036 | SECTOR: PHARMA

Stock closed the Weekly on negative note loosing 1.17%

Sun Pharma Share Price: 955.55

Weekly High: 979.50

Weekly Low:  946.10

Weekly Range: 11.35 Points

Weekly Support & Resistance For Sun Pharma:

RESISTANCE 2993
RESISTANCE 1974
SUPPORT 1941
SUPPORT 2927
Sun Pharma Outlook for the Week (Mar 13, 2023 – March 17, 2023)

Technically on the daily charts EquityPandit’s Analyst see: Minor support on the downside lies at 941 levels, Minor resistance on the upside is capped around 974 levels.

If stock breaches minor support on the downside and closes below it we may see fresh break down and stock can drag towards Major Support on lower side @ 927 and If stock breaches minor resistance on the upside and closes above it we may see fresh breakout and stock can head towards Major Resistances Level @ 993

Stock is trading  on  200 days exponential moving average, suggests long term trend is nutral. EquityPandit predicts range for the Weekly as 993 upside and 927 on downside.

SUN PHARMA

Sun Pharma Outlook for the Week (Jan 30, 2023 – Feb 03, 2023)

Prateek Gupta

Check SUNPHARMA Full Analysis At Unicorn Signals

SUNPHARMA Weekly Outlook and Analysis:

For the Week: (Jan 30, 2023 – Feb 03, 2023)

Sun Pharma Outlook for the Week (Jan 30, 2023 – Feb 03, 2023)

Check SUNPHARMA Full Analysis At Unicorn Signals

BSE: 524715| NSE: SUNPHARMA| ISIN: INE044A01036 | SECTOR: PHARMA

Stock closed the Weekly on positive note gaining 1.27%

Sun Pharma Share Price: 1043.40

Weekly High: 1054.90

Weekly Low:  1022.50

Weekly Range: 13.05 Points

Weekly Support & Resistance For Sun Pharma:

RESISTANCE 21071
RESISTANCE 11057
SUPPORT 11032
SUPPORT 21025
Sun Pharma Outlook for the Week (Jan 30, 2023 – Feb 03, 2023)

Technically on the daily charts EquityPandit’s Analyst see: Minor support on the downside lies at 1032 levels, Minor resistance on the upside is capped around 1057 levels.

If stock breaches minor support on the downside and closes below it we may see fresh break down and stock can drag towards Major Support on lower side @ 1025 and If stock breaches minor resistance on the upside and closes above it we may see fresh breakout and stock can head towards Major Resistances Level @ 1071

Stock is trading  above 200 days exponential moving average, suggests long term trend is bullish. EquityPandit predicts range for the Weekly as 1071 upside and 1025 on downside.

Latest
IPO
Weekly
Outlook

Stock
Market
Prediction