In the previous session, the Nifty index consolidated with a positive bias throughout the day. The Nifty index saw a positive opening and made a high near 18072 level. Nifty has just closed above its 20-day moving average, placed at 18053. The index formed a long bullish candle which is a bullish sign for tomorrow. Hence, we recommend approaching the markets in a positive way. Use a trailing Stop loss method to protect your profit at higher levels.
Look at the below research report of ‘Stocks to Buy for Wednesday, January 18,2023’ before the market opens.
Raymond Ltd.

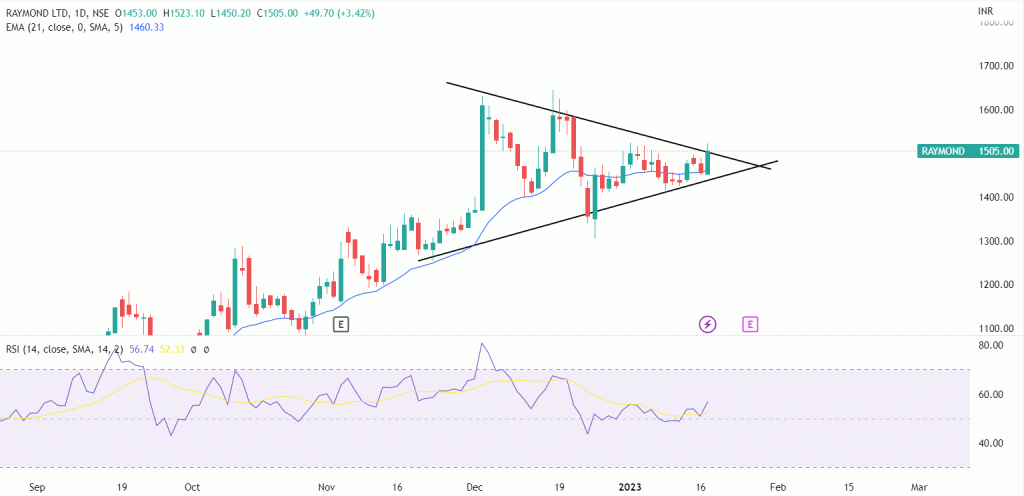
In the daily time frame, share prices are moving in the form of the ‘Symmetrical Triangle’ pattern. As shown on the chart, prices have given a breakout above the neckline in the previous session. A white bullish window appeared on the daily chart. As per the chart reading, a long entry signal will be triggered only above the previous day’s closing level. Stock comfortably closed above the 21 days EMA support which indicates short term bullishness.
In short, the trend for RAYMOND looks to be positive for now. We can expect it to reach a target of 1636 levels based on our analysis. This outlook is valid as long as we do not see any closing below 20 EMA. If the price will sustain near 1636 levels, then we will review this stock again.
Check More Analysis on RAYMOND at: Raymond Ltd.


