In the previous session, the Nifty index saw a gap down opening in the morning but rebounded at an important support level. The index got stronger as the day progressed and closed with a net gain of 86 points. The Nifty index formed a bullish candle on the daily chart indicating positive bias in the market. Hence, we recommend approaching the markets in a positive way. Use a trailing Stop loss method to protect your profit at higher levels.
Look at the below research report of ‘Stocks to Buy for Thursday, February 16,2023’ before the market open.
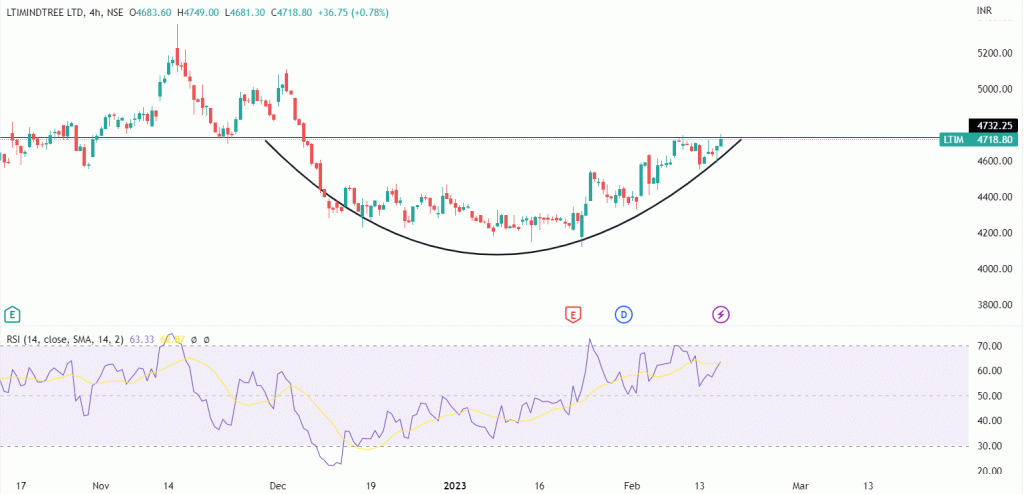
LTI Mindtree Ltd

On the daily chart, we can see that prices have formed a ‘Rounding Bottom pattern’ and are currently placed near the Neckline resistance zone. It is also called a ‘Saucer pattern’ and represents a long consolidation period that turns from a bearish bias to a bullish. Stock is facing hurdles at 4740-4750 levels for the past few days. Now this level has become a temporally immediate resistance for the stock. It would be important to see if it sustains above the same in the coming session which would further validate the emerging trend on the upside.
The stock has been moving in sync with our expectations. Stock looks to be at a crucial juncture but with bullish up move expecting. Break above 4750 levels which could take prices towards 4895/5110 levels. On downside stop loss can be placed near 4550 levels.
Check More Analysis on LTIM at: LTI Mindtree Ltd


