BSE
prev close
OPEN PRICE
bid price (qty)
offer price (qty)
volume
Today's low / high
52 WK low / high
NSE
prev close
open price
bid price (qty)
offer price (qty)
volume
Today's' low / high
52 WK low / high
| 30 Apr 332.77 (-1.22%) | 29 Apr 336.88 (-0.07%) | 26 Apr 337.12 (0.18%) | 25 Apr 336.51 (0.42%) | 24 Apr 335.09 (-0.76%) | 23 Apr 337.65 (0.20%) | 22 Apr 336.97 (0.60%) | 19 Apr 334.97 (-0.19%) | 18 Apr 335.61 (-0.45%) | 16 Apr 337.12 (-2.43%) | 15 Apr 345.52 (-1.60%) | 12 Apr 351.13 (-0.85%) | 10 Apr 354.15 (0.80%) | 09 Apr 351.35 (-0.04%) | 08 Apr 351.48 (-0.49%) | 05 Apr 353.22 (-0.89%) | 04 Apr 356.40 (1.43%) | 03 Apr 351.37 (-1.23%) | 02 Apr 355.75 (1.28%) | 01 Apr 351.27 (0.33%) | 28 Mar 350.13 (0.49%) |
Price Chart Historical Data Technical Chart
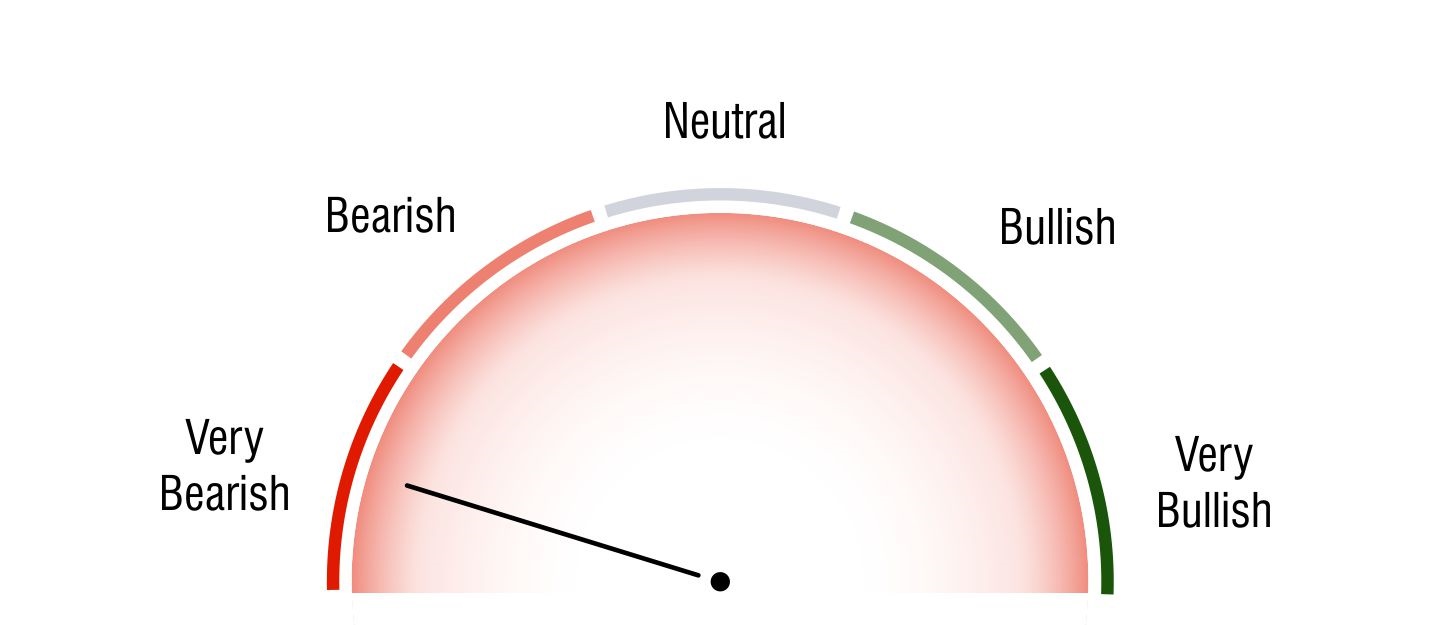
Technical Analysis
Short Term Investors

Very Bearish
Medium Term Investors

Very Bearish
Long Term Investors

Bullish
Moving Averages
5 DMA
Bearish
336.87
10 DMA
Bearish
338.03
20 DMA
Bearish
345.63
50 DMA
Bearish
361.89
100 DMA
Bullish
0
200 DMA
Bullish
0
Intraday Support and Resistance
(Based on Pivot Points) |
Updated On Apr 30, 2024 04:00 PM For Next Trading Session
| Pivots | Classic | Fibonacci | Camarilla | Woodie | DM |
|---|---|---|---|---|---|
| R3 | 341.58 | 339.51 | 334.27 | - | - |
| R2 | 339.51 | 337.43 | 333.77 | 339.19 | - |
| R1 | 336.14 | 336.15 | 333.27 | 335.5 | 337.83 |
| P | 334.07 | 334.07 | 334.07 | 333.75 | 334.91 |
| S1 | 330.7 | 331.99 | 332.27 | 330.06 | 332.39 |
| S2 | 328.63 | 330.71 | 331.77 | 328.31 | - |
| S3 | 325.26 | 328.63 | 331.27 | - | - |


