Metro Brands Ltd
NSE :METROBRAND BSE :543426 Sector : LeatherBuy, Sell or Hold METROBRAND? Ask The Analyst
BSE
Apr 22, 00:00
1102.55
8.95 (0.82%)
prev close
1093.60
OPEN PRICE
1111.95
volume
652
Today's low / high
1085.05 / 1111.95
52 WK low / high
890.30 / 1430.10
bid price (qty)
0 (0)
offer price (qty)
0 (0)
NSE
Apr 22, 00:00
1101.90
7.90 (0.72%)
prev close
1094.00
open price
1084.10
volume
56905
Today's' low / high
1084.10 / 1109.80
52 WK low / high
990.05 / 1430.00
bid price (qty)
1101.90 (16)
offer price (qty)
0 (0)
| 22 Apr 1101.90 (0.72%) | 21 Apr 1094.00 (-0.17%) | 17 Apr 1095.90 (0.08%) | 16 Apr 1095.00 (0.16%) | 15 Apr 1093.20 (2.95%) | 11 Apr 1061.85 (1.70%) | 09 Apr 1044.10 (-0.61%) | 08 Apr 1050.50 (0.86%) | 07 Apr 1041.55 (-2.40%) | 04 Apr 1067.20 (-0.56%) | 03 Apr 1073.25 (1.18%) | 02 Apr 1060.75 (1.79%) | 01 Apr 1042.05 (2.84%) | 28 Mar 1013.30 (0.21%) | 27 Mar 1011.20 (-4.18%) | 26 Mar 1055.30 (-1.44%) | 25 Mar 1070.70 (-0.55%) | 24 Mar 1076.65 (0.26%) | 21 Mar 1073.85 (0.38%) | 20 Mar 1069.80 (-0.83%) | 19 Mar 1078.75 (2.65%) |
Technical Analysis
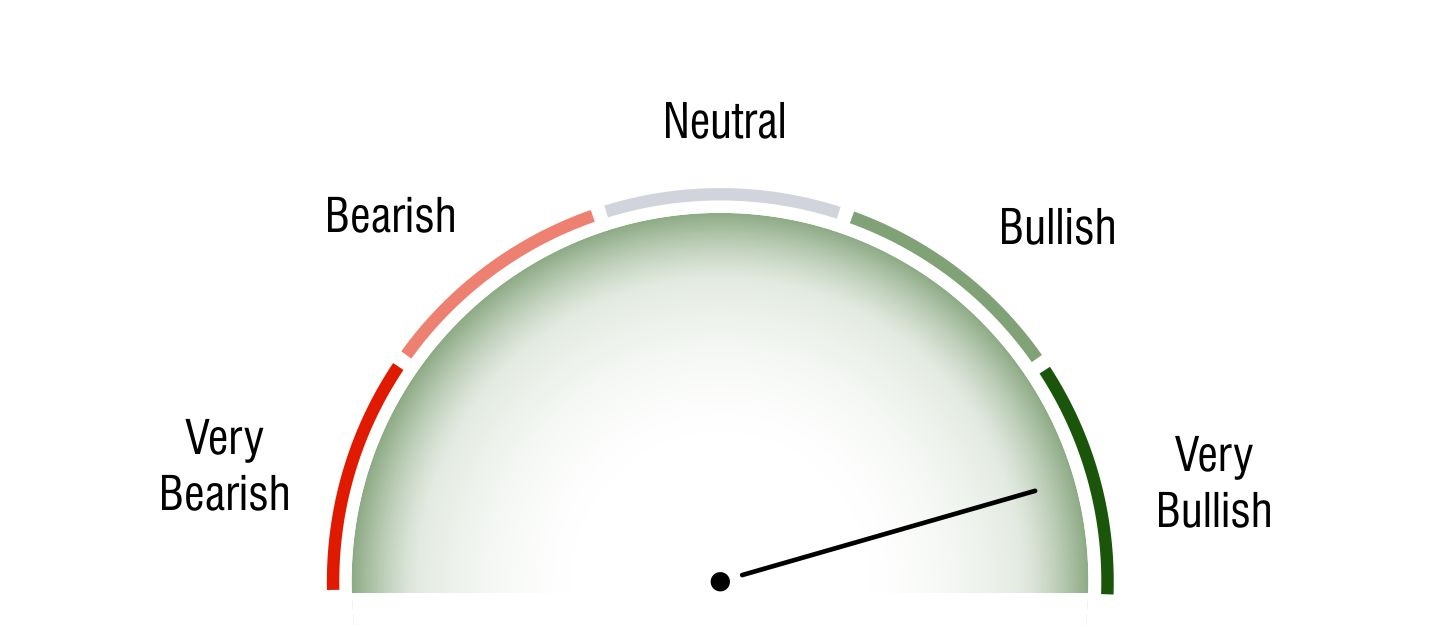
Short Term Investors

Very Bullish
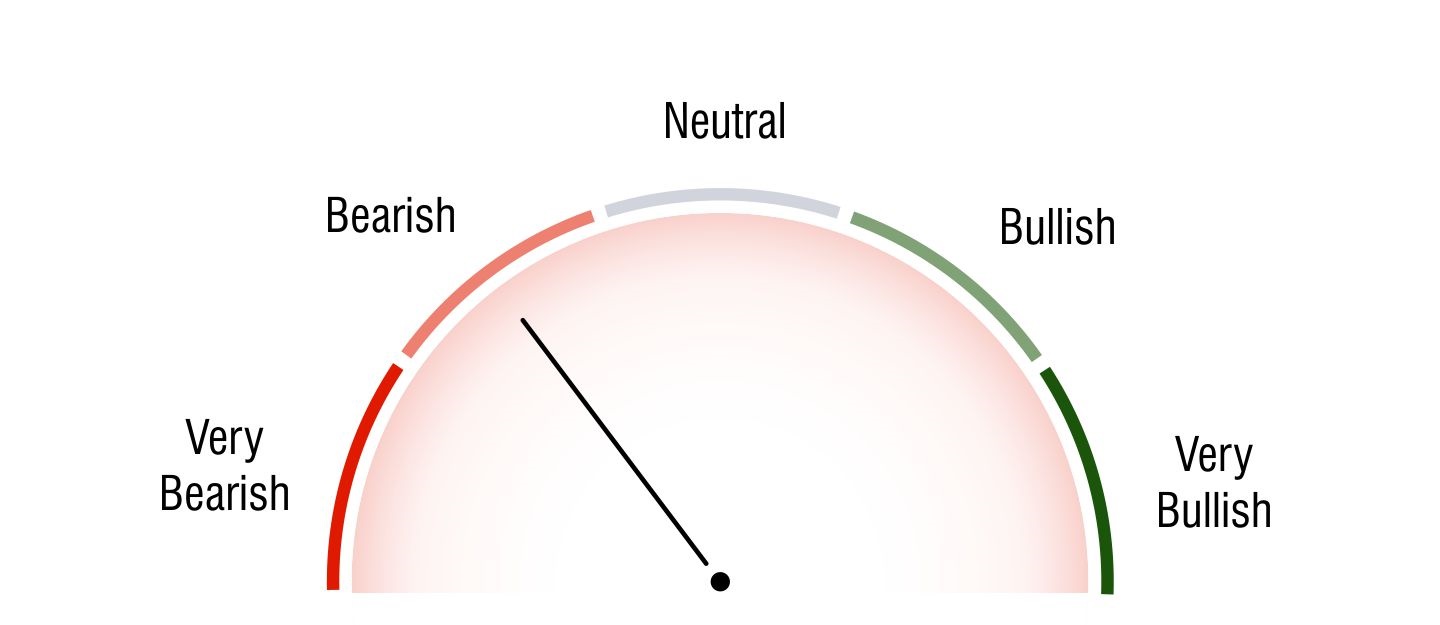
Medium Term Investors

Bearish
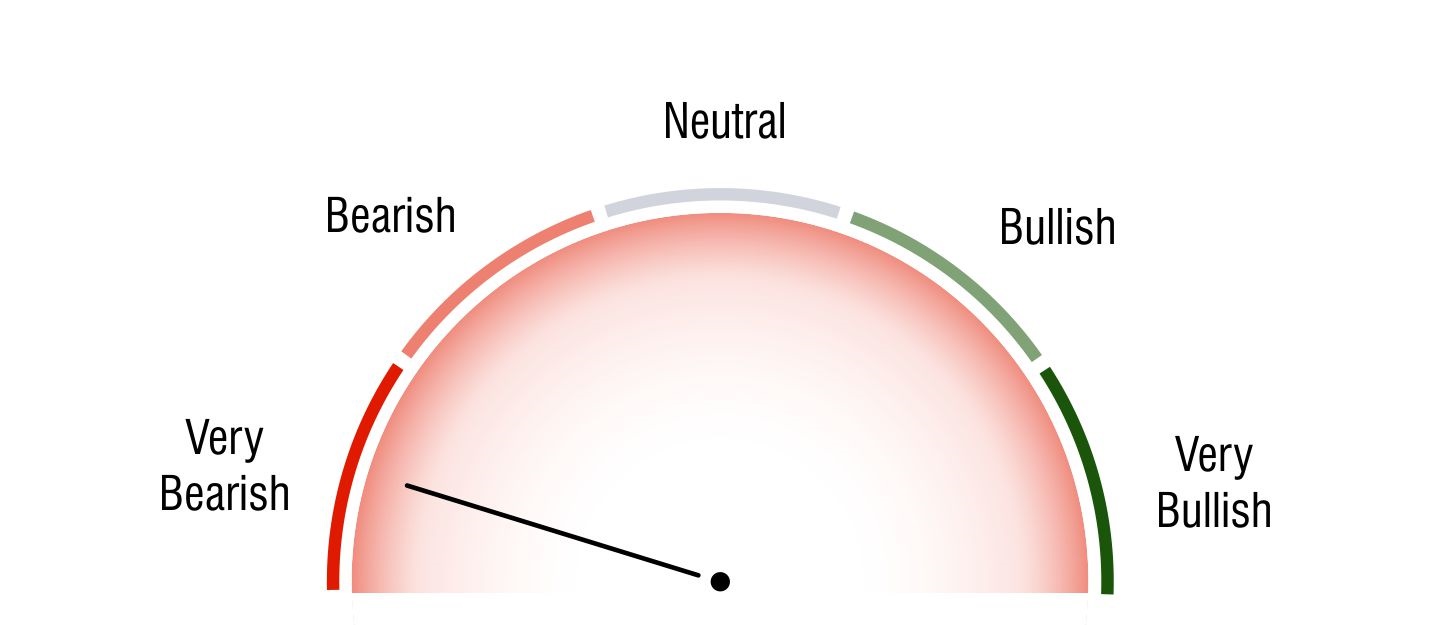
Long Term Investors

Very Bearish
Moving Averages
5 DMA
Bullish
1096.18
10 DMA
Bullish
1074.56
20 DMA
Bullish
1064.58
50 DMA
Bearish
1115.35
100 DMA
Bearish
1178.05
200 DMA
Bearish
1217.56
Intraday Support and Resistance
(Based on Pivot Points) NSE : 1101.90 | BSE : 1102.55
Updated On Apr 22, 2025 04:00 PM For Next Trading Session
| Pivots | Classic | Fibonacci | Camarilla | Woodie | DM |
|---|---|---|---|---|---|
| R3 | 1138.8 | 1124.3 | 1108.97 | - | - |
| R2 | 1124.3 | 1114.48 | 1106.61 | 1125.13 | - |
| R1 | 1113.1 | 1108.42 | 1104.26 | 1114.76 | 1118.7 |
| P | 1098.6 | 1098.6 | 1098.6 | 1099.43 | 1101.4 |
| S1 | 1087.4 | 1088.78 | 1099.54 | 1089.06 | 1093 |
| S2 | 1072.9 | 1082.72 | 1097.19 | 1073.73 | - |
| S3 | 1061.7 | 1072.9 | 1094.83 | - | - |
Key Metrics
EPS
15.31
P/E
72.02
P/B
15.49
Dividend Yield
0.45%
Market Cap
29,999 Cr.
Face Value
5
Book Value
71.2
ROE
24.18%
EBITDA Growth
247.24 Cr.
Debt/Equity
0.6
Shareholding History
Quarterly Result (Figures in Rs. Crores)
Metro Brands Ltd Quaterly Results
| Dec 2023 | Mar 2024 | Jun 2024 | Sep 2024 | Dec 2024 | ||
| INCOME | 651.45 | 607.33 | 599.45 | 608.81 | 726.29 | |
| PROFIT | 97.81 | 155.17 | 91.73 | 69.55 | 94.58 | |
| EPS | 3.6 | 5.71 | 3.37 | 2.56 | 3.48 |
Metro Brands Ltd Quaterly Results
| Dec 2023 | Mar 2024 | Jun 2024 | Sep 2024 | Dec 2024 | ||
| INCOME | 638.86 | 602.28 | 586.19 | 589.22 | 710.42 | |
| PROFIT | 95.67 | 164.57 | 92.35 | 65.67 | 94.12 | |
| EPS | 3.52 | 6.05 | 3.4 | 2.41 | 3.46 |
Profit & Loss (Figures in Rs. Crores)
Metro Brands Ltd Profit & Loss
| Mar 2015 | Mar 2016 | Mar 2017 | Mar 2018 | Mar 2019 | Mar 2020 | Mar 2021 | Mar 2022 | Mar 2023 | Mar 2024 | ||
| INCOME | 871.69 | 927.64 | 1070.28 | 1119.92 | 1322.11 | 1322.59 | 792.16 | 1536.01 | 2355.25 | 2491.9 | |
| PROFIT | 81.51 | 85.12 | 90.41 | 139.91 | 148.67 | 158.58 | 66.65 | 211.32 | 357.58 | 412.81 | |
| EPS | 0 | 0 | 0 | 0 | 0 | 0 | 0 | 7.84 | 13.37 | 15.17 |
Metro Brands Ltd Profit & Loss
| Mar 2015 | Mar 2016 | Mar 2017 | Mar 2018 | Mar 2019 | Mar 2020 | Mar 2021 | Mar 2022 | Mar 2023 | Mar 2024 | ||
| INCOME | 737.88 | 888.65 | 904.33 | 1074.01 | 1243.81 | 1224.28 | 831.74 | 1505.23 | 2295.39 | 2447.85 | |
| PROFIT | 78.58 | 82.24 | 88.28 | 136.51 | 148.68 | 153.74 | 70.93 | 207.37 | 350.13 | 418.14 | |
| EPS | 53.85 | 55.71 | 62.13 | 91.78 | 11.14 | 11.44 | 2.73 | 7.65 | 13.03 | 15.37 |
Balance Sheet (Figures in Rs. Crores)
| Mar 2024 | Mar 2023 | Mar 2022 | Mar 2021 | Mar 2020 | Mar 2019 | Mar 2018 | Mar 2017 | Mar 2016 | Mar 2015 | |
| SOURCES OF FUNDS : | ||||||||||
| Share Capital | 135.95 | 135.87 | 135.75 | 132.77 | 132.77 | 132.77 | 14.73 | 14.73 | 14.73 | 14.72 |
| Reserves Total | 1,727.61 | 1,411.84 | 1,128.94 | 694.81 | 674.52 | 517.1 | 562.41 | 448.68 | 381.31 | 318.37 |
| Equity Application Money | 0.15 | 0.02 | 0 | 0 | 0 | 0 | 0 | 0 | 0 | 0 |
| Total Shareholders Funds | 1,863.71 | 1,547.73 | 1,264.69 | 827.58 | 807.29 | 649.87 | 577.14 | 463.41 | 396.04 | 333.09 |
| Minority Interest | 29.38 | 26.4 | 22.44 | 19.86 | 23.47 | 19.52 | 14.65 | 12.21 | 8.65 | 6.17 |
| Secured Loans | 0 | 1.52 | 0 | 0 | 11.52 | 9.86 | 5.99 | 1.52 | 1.13 | 5.3 |
| Unsecured Loans | 1,098.43 | 941.44 | 692.22 | 566.9 | 537.63 | 414.6 | 0.03 | 1.44 | 1.91 | 2.99 |
| Total Debt | 1,098.43 | 942.96 | 692.22 | 566.9 | 549.15 | 424.46 | 6.02 | 2.96 | 3.04 | 8.29 |
| Other Liabilities | 1.04 | 4.52 | 0.63 | 0.63 | 0.56 | 0.58 | 0.37 | 5.22 | 4.01 | 3.04 |
| Total Liabilities | 2,992.56 | 2,521.61 | 1,979.98 | 1,414.97 | 1,380.47 | 1,094.43 | 598.18 | 483.8 | 411.74 | 350.59 |
| APPLICATION OF FUNDS : | ||||||||||
| Gross Block | 2,141.23 | 1,790.42 | 1,276.5 | 1,039.37 | 979.79 | 756.59 | 261.01 | 233.77 | 185.26 | 165.7 |
| Less: Accumulated Depreciation | 658.93 | 488.32 | 428.73 | 315.78 | 271.75 | 163.58 | 76.4 | 61.77 | 50.74 | 43.34 |
| Net Block | 1,482.3 | 1,302.1 | 847.77 | 723.59 | 708.04 | 593.01 | 184.61 | 172 | 134.52 | 122.36 |
| Capital Work in Progress | 9.3 | 17.84 | 6.19 | 4.54 | 13.03 | 4.07 | 6.01 | 4.32 | 0.6 | 0.39 |
| Investments | 749.95 | 477.62 | 401.04 | 399.67 | 348.35 | 209.86 | 184.51 | 83.2 | 76.4 | 36.84 |
| Inventories | 710.15 | 645.76 | 424.19 | 289.75 | 376.13 | 364.62 | 279.41 | 266.42 | 232.65 | 225.66 |
| Sundry Debtors | 75.67 | 105.27 | 48.39 | 50.55 | 70.13 | 51.93 | 39.36 | 32.73 | 23.03 | 21.52 |
| Cash and Bank Balance | 112.26 | 198.5 | 396.46 | 87.92 | 10.88 | 12.09 | 15.45 | 25.15 | 6.5 | 7.2 |
| Loans and Advances | 58.54 | 87.46 | 97.1 | 37.3 | 34.07 | 33.75 | 19.59 | 18.35 | 15.33 | 16.73 |
| Total Current Assets | 956.62 | 1,036.99 | 966.13 | 465.53 | 491.22 | 462.38 | 353.8 | 342.65 | 277.51 | 271.11 |
| Current Liabilities | 350.24 | 374.39 | 312.06 | 239.19 | 234.48 | 222.83 | 164.15 | 148.96 | 101.38 | 102.46 |
| Provisions | 9.88 | 10.37 | 12.79 | 5.18 | 2.48 | 4.25 | 7.36 | 3.71 | 3.64 | 2.26 |
| Total Current Liabilities & Provisions | 360.12 | 384.76 | 324.85 | 244.37 | 236.96 | 227.08 | 171.52 | 152.67 | 105.02 | 104.72 |
| Net Current Assets | 596.5 | 652.23 | 641.29 | 221.16 | 254.26 | 235.3 | 182.29 | 189.98 | 172.49 | 166.39 |
| Deferred Tax Assets | 285.88 | 242.5 | 22.3 | 21.24 | 18.6 | 14.13 | 0.16 | 0.13 | 0.42 | 0.65 |
| Deferred Tax Liability | 249.63 | 237.59 | 0 | 4.57 | 6.21 | 0 | 2.44 | 0.15 | 0.05 | 0.04 |
| Net Deferred Tax | 36.25 | 4.91 | 22.3 | 16.67 | 12.39 | 14.13 | -2.28 | -0.02 | 0.37 | 0.61 |
| Other Assets | 118.26 | 66.91 | 61.4 | 49.34 | 44.39 | 38.06 | 43.04 | 34.32 | 27.35 | 24.01 |
| Total Assets | 2,992.56 | 2,521.61 | 1,979.99 | 1,414.97 | 1,380.47 | 1,094.43 | 598.18 | 483.79 | 411.73 | 350.6 |
| Contingent Liabilities | 6.44 | 2.77 | 2.56 | 12.58 | 8.33 | 14.07 | 25.3 | 18.49 | 21.59 | 22.31 |
| Mar 2024 | Mar 2023 | Mar 2022 | Mar 2021 | Mar 2020 | Mar 2019 | Mar 2018 | Mar 2017 | Mar 2016 | Mar 2015 | |
| SOURCES OF FUNDS : | ||||||||||
| Share Capital | 135.96 | 135.87 | 135.75 | 132.77 | 132.77 | 132.77 | 14.73 | 14.73 | 14.73 | 14.72 |
| Reserves Total | 1,699 | 1,377.64 | 1,102.14 | 671.88 | 647.25 | 531.78 | 546.65 | 441.27 | 373.55 | 313.51 |
| Equity Application Money | 0.15 | 0.02 | 0 | 0 | 0 | 0 | 0 | 0 | 0 | 0 |
| Total Shareholders Funds | 1,835.11 | 1,513.53 | 1,237.89 | 804.65 | 780.02 | 664.55 | 561.38 | 456 | 388.28 | 328.23 |
| Unsecured Loans | 1,098.43 | 938.2 | 692.22 | 565.5 | 536.43 | 0 | 0 | 0 | 0 | 0 |
| Total Debt | 1,098.43 | 938.2 | 692.22 | 565.5 | 536.43 | 0 | 0 | 0 | 0 | 0 |
| Other Liabilities | 0.32 | 4.98 | 0 | 0 | 0 | 0 | 0 | 4.73 | 3.79 | 3.04 |
| Total Liabilities | 2,933.86 | 2,456.71 | 1,930.11 | 1,370.15 | 1,316.45 | 664.55 | 561.38 | 460.73 | 392.07 | 331.27 |
| APPLICATION OF FUNDS : | ||||||||||
| Gross Block | 2,127.97 | 1,769.51 | 1,272.89 | 1,034.76 | 903.45 | 312.88 | 258.65 | 230.25 | 183.9 | 164.47 |
| Less : Accumulated Depreciation | 652.26 | 483.08 | 426.28 | 312.73 | 198.55 | 91.05 | 75.24 | 60.01 | 50.08 | 42.86 |
| Net Block | 1,475.71 | 1,286.43 | 846.61 | 722.03 | 704.9 | 221.83 | 183.41 | 170.24 | 133.82 | 121.61 |
| Capital Work in Progress | 9.3 | 17.84 | 6.19 | 4.54 | 13.03 | 4.07 | 6.01 | 4.32 | 0.6 | 0.39 |
| Investments | 764.79 | 495.55 | 397.6 | 397.41 | 345.5 | 207.81 | 183.99 | 95.62 | 76.53 | 36.96 |
| Inventories | 698.19 | 624.64 | 418.9 | 284.46 | 320 | 330.74 | 259.82 | 249.84 | 222.84 | 217.65 |
| Sundry Debtors | 37.49 | 47.71 | 20.94 | 22.49 | 8.09 | 10.21 | 6.35 | 4.63 | 2.52 | 2.45 |
| Cash and Bank Balance | 87.34 | 183.06 | 394.28 | 83.38 | 10.44 | 11.64 | 15.2 | 24.87 | 6.29 | 7.16 |
| Loans and Advances | 61.52 | 91.56 | 95.66 | 38.73 | 49.34 | 48.67 | 27.87 | 22.99 | 17.31 | 20.52 |
| Total Current Assets | 884.54 | 946.97 | 929.78 | 429.05 | 387.87 | 401.26 | 309.24 | 302.33 | 248.97 | 247.77 |
| Current Liabilities | 345.72 | 361.13 | 311.83 | 236.72 | 187.4 | 207.98 | 158.66 | 142.73 | 92.13 | 97.88 |
| Provisions | 9.61 | 9.72 | 12.63 | 5 | 2.38 | 4.12 | 1.87 | 0.3 | 3.46 | 2.17 |
| Total Current Liabilities & Provisions | 355.33 | 370.85 | 324.47 | 241.72 | 189.79 | 212.1 | 160.53 | 143.03 | 95.6 | 100.06 |
| Net Current Assets | 529.21 | 576.12 | 605.31 | 187.33 | 198.09 | 189.16 | 148.71 | 159.3 | 153.37 | 147.72 |
| Deferred Tax Assets | 284.33 | 218.14 | 26.23 | 20.51 | 17.18 | 0 | 0 | 0.14 | 0.42 | 0.65 |
| Deferred Tax Liability | 247.37 | 212.19 | 4.39 | 4.57 | 6.21 | 7.26 | 3.73 | 2.84 | 0 | 0 |
| Net Deferred Tax | 36.96 | 5.95 | 21.84 | 15.94 | 10.97 | -7.26 | -3.73 | -2.7 | 0.42 | 0.65 |
| Other Assets | 117.89 | 74.82 | 52.57 | 42.88 | 43.95 | 48.94 | 42.98 | 33.96 | 27.34 | 23.94 |
| Total Assets | 2,933.86 | 2,456.71 | 1,930.12 | 1,370.13 | 1,316.44 | 664.55 | 561.38 | 460.73 | 392.07 | 331.27 |
| Contingent Liabilities | 4.19 | 1.34 | 1.15 | 37.58 | 43.45 | 47.22 | 54.55 | 46.32 | 31.41 | 0 |
Cash Flow (Figures in Rs. Crores)
| Net Profit before Tax and Extr... | 462.38 |
| Depreciation | 229.12 |
| Interest (Net) | 34.22 |
| Dividend Received | 0.47 |
| P/L on Sales of Assets | 4.35 |
| P/L on Sales of Invest | -3.99 |
| Prov. and W/O (Net) | -3.43 |
| Fin. Lease and Rental Charges | -3.39 |
| Total Adjustments (PBT and Ext... | 260.65 |
| Operating Profit before Workin... | 723.03 |
| Trade and 0ther Receivables | 29.6 |
| Inventories | -64.39 |
| Trade Payables | -41.5 |
| Total Adjustments (OP before W... | -48.95 |
| Cash Generated from/(used in) ... | 674.08 |
| Direct Taxes Paid | -84 |
| Total Adjustments(Cash Generat... | -84 |
| Cash Flow before Extraordinary... | 590.08 |
| Net Cash from Operating Activi... | 590.08 |
| Purchased of Fixed Assets | -116.13 |
| Sale of Fixed Assets | 5.06 |
| Purchase of Investments | -1,629.32 |
| Sale of Investments | 1,373.49 |
| Interest Received | 47.81 |
| Net Cash used in Investing Act... | -251.32 |
| Proceeds from Issue of shares ... | 4.2 |
| Share Application Money | 0.15 |
| Of the Long Tem Borrowings | -1.52 |
| Of Financial Liabilities | -209.71 |
| Dividend Paid | -115.53 |
| Interest Paid | -0.26 |
| Net Cash used in Financing Act... | -322.67 |
| Net Profit before Tax and Extr... | 465.85 |
| Depreciation | 227.61 |
| Interest (Net) | 34.46 |
| Dividend Received | 0.47 |
| P/L on Sales of Assets | 4.35 |
| P/L on Sales of Invest | -3.95 |
| Prov. and W/O (Net) | -3.42 |
| Fin. Lease and Rental Charges | -3.39 |
| Total Adjustments (PBT and Ext... | 259.36 |
| Operating Profit before Workin... | 725.21 |
| Trade and 0ther Receivables | 11.29 |
| Inventories | -73.55 |
| Trade Payables | -36.53 |
| Total Adjustments (OP before W... | -58.23 |
| Cash Generated from/(used in) ... | 666.98 |
| Direct Taxes Paid | -82.44 |
| Total Adjustments(Cash Generat... | -82.44 |
| Cash Flow before Extraordinary... | 584.54 |
| Net Cash from Operating Activi... | 584.54 |
| Purchased of Fixed Assets | -115.88 |
| Sale of Fixed Assets | 0.95 |
| Purchase of Investments | -1,629.4 |
| Sale of Investments | 1,373.45 |
| Interest Received | 43.69 |
| Net Cash used in Investing Act... | -250.28 |
| Proceeds from Issue of shares ... | 4.2 |
| Share Application Money | 0.15 |
| Of Financial Liabilities | -207.41 |
| Dividend Paid | -115.53 |
| Net Cash used in Financing Act... | -318.59 |
Company Details
Registered Office |
|
| Address | 401 Zillion 4th Floor, LBS Marg & CST Road Junction |
| City | Mumbai |
| State | Maharashtra |
| Pin Code | 400070 |
| Tel. No. | 91-22-26547700 |
| Fax. No. | |
| investor.relations@metrobrands.com | |
| Internet | http://www.metrobrands.com |
Registrars |
|
| Address | 401 Zillion 4th Floor |
| City | Mumbai |
| State | Maharashtra |
| Pin Code | 400070 |
| Tel. No. | 91-22-26547700 |
| Fax. No. | |
| investor.relations@metrobrands.com | |
| Internet | http://www.metrobrands.com |
Management |
|
| Name | Designation |
| Rafique A Malik | Executive Chairman |
| FARAH MALIK BHANJI | Managing Director |
| Mohammed Iqbal Hasanally Dossani | Whole-time Director |
| Utpal Seth | Nominee |
| Arvind Kumar Singhal | Independent Director |
| VIKAS VIJAYKUMAR KHEMANI | Independent Director |
| Srikanth Ramakrishna Velamakanni | Independent Director |
| DEEPA SOOD | Vice President & CS |
| Mithun Padamchand Sacheti | Independent Director |
| Alisha Rafique Malik | Whole-time Director |
| Radhika Piramal | Additional Director |
| Bhaskar Bhat | Additional Director |

