Bikewo Green Tech Ltd
NSE :BIKEWO BSE :92986 Sector : AutomobileBuy, Sell or Hold BIKEWO? Ask The Analyst
BSE
prev close
OPEN PRICE
bid price (qty)
offer price (qty)
volume
Today's low / high
52 WK low / high
NSE
prev close
open price
bid price (qty)
offer price (qty)
volume
Today's' low / high
52 WK low / high
| 20 Dec 29.05 (-1.19%) | 19 Dec 29.40 (0.00%) | 18 Dec 29.40 (-1.67%) | 17 Dec 29.90 (-0.83%) | 16 Dec 30.15 (-0.17%) | 13 Dec 30.20 (-0.33%) | 12 Dec 30.30 (-0.66%) | 11 Dec 30.50 (0.99%) | 10 Dec 30.20 (-1.63%) | 09 Dec 30.70 (-0.16%) | 06 Dec 30.75 (-0.16%) | 05 Dec 30.80 (-1.60%) | 04 Dec 31.30 (-5.01%) | 03 Dec 32.95 (1.85%) | 02 Dec 32.35 (13.91%) | 29 Nov 28.40 (1.25%) | 28 Nov 28.05 (-1.41%) | 27 Nov 28.45 (1.61%) | 26 Nov 28.00 (-2.44%) | 25 Nov 28.70 (0.17%) | 22 Nov 28.65 (-0.87%) |
Price Chart Historical Data Technical Chart
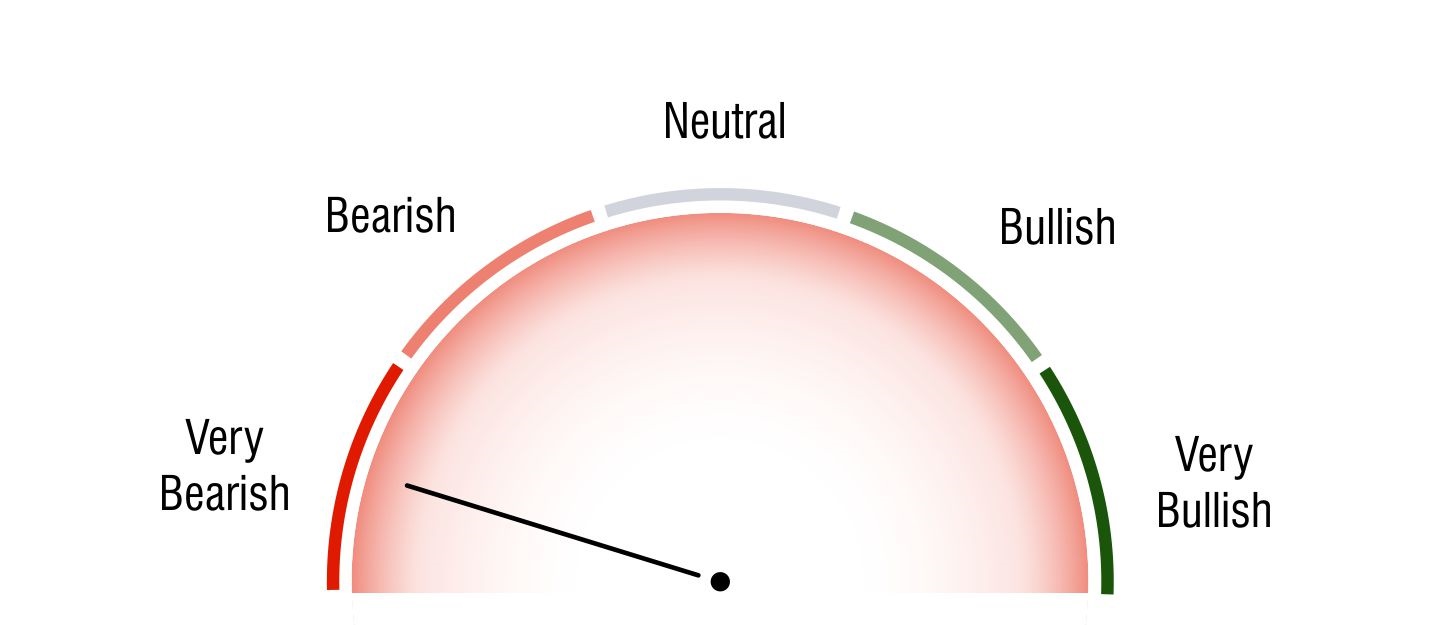
Technical Analysis
Short Term Investors

Very Bearish
Medium Term Investors

Very Bearish
Long Term Investors

Bullish
Moving Averages
5 DMA
Bearish
29.58
10 DMA
Bearish
29.98
20 DMA
Bearish
29.98
50 DMA
Bearish
31.31
100 DMA
Bullish
0
200 DMA
Bullish
0
Intraday Support and Resistance
(Based on Pivot Points) |
Updated On Dec 20, 2024 04:00 PM For Next Trading Session
| Pivots | Classic | Fibonacci | Camarilla | Woodie | DM |
|---|---|---|---|---|---|
| R3 | 30.44 | 30.12 | 29.28 | - | - |
| R2 | 30.12 | 29.8 | 29.21 | 30.06 | - |
| R1 | 29.59 | 29.59 | 29.13 | 29.47 | 29.85 |
| P | 29.27 | 29.27 | 29.27 | 29.21 | 29.4 |
| S1 | 28.74 | 28.95 | 28.97 | 28.62 | 29 |
| S2 | 28.42 | 28.74 | 28.89 | 28.36 | - |
| S3 | 27.89 | 28.42 | 28.82 | - | - |
Key Metrics
Shareholding History
Quarterly Result (Figures in Rs. Crores)
Bikewo Green Tech Ltd Quaterly Results
| INCOME | |||||
| PROFIT | |||||
| EPS |
Bikewo Green Tech Ltd Quaterly Results
| INCOME | 9.92 | 7.07 | |||
| PROFIT | 0.81 | 0.36 | |||
| EPS | 0.88 | 0.4 |
Profit & Loss (Figures in Rs. Crores)
Bikewo Green Tech Ltd Profit & Loss
| INCOME | |
| PROFIT | |
| EPS |
Bikewo Green Tech Ltd Profit & Loss
| Mar 2021 | Mar 2022 | Mar 2023 | Mar 2024 | ||
| INCOME | 22.05 | 15.72 | 22.91 | 28.08 | |
| PROFIT | 0.47 | 0.15 | 0.1 | 1.67 | |
| EPS | 4.73 | 0.74 | 0.48 | 1.83 |
Balance Sheet (Figures in Rs. Crores)
| Mar 2024 | Mar 2023 | Mar 2022 | Mar 2021 | |
| SOURCES OF FUNDS : | ||||
| Share Capital | 9.16 | 2.04 | 2.04 | 1 |
| Reserves Total | 7.61 | 5.19 | 5.09 | 2.65 |
| Total Shareholders Funds | 16.77 | 7.23 | 7.13 | 3.65 |
| Secured Loans | 5.7 | 6 | 6.88 | 4.08 |
| Unsecured Loans | 1.83 | 1.61 | 0 | 3.28 |
| Total Debt | 7.53 | 7.61 | 6.88 | 7.36 |
| Total Liabilities | 24.3 | 14.84 | 14.01 | 11.01 |
| APPLICATION OF FUNDS : | ||||
| Gross Block | 2.92 | 2.95 | 3.73 | 1.82 |
| Less : Accumulated Depreciation | 0.93 | 0.6 | 0.45 | 0.15 |
| Net Block | 1.99 | 2.35 | 3.28 | 1.67 |
| Capital Work in Progress | 9.55 | 7.07 | 4.62 | 2.76 |
| Inventories | 10.35 | 7.41 | 5.12 | 3.32 |
| Sundry Debtors | 0.77 | 1.09 | 0.05 | 1.78 |
| Cash and Bank Balance | 0.07 | 0.04 | 0.02 | 0.18 |
| Loans and Advances | 8.78 | 1.65 | 1.85 | 2.45 |
| Total Current Assets | 19.98 | 10.19 | 7.05 | 7.73 |
| Current Liabilities | 6.53 | 4.75 | 0.76 | 1.02 |
| Provisions | 0.55 | 0 | 0.17 | 0.13 |
| Total Current Liabilities & Provisions | 7.08 | 4.75 | 0.93 | 1.15 |
| Net Current Assets | 12.9 | 5.44 | 6.12 | 6.58 |
| Deferred Tax Assets | 0 | 0 | 0 | 0.01 |
| Deferred Tax Liability | 0.14 | 0.03 | 0.03 | 0.01 |
| Net Deferred Tax | -0.14 | -0.03 | -0.03 | 0 |
| Other Assets | 0 | 0.02 | 0.02 | 0 |
| Total Assets | 24.29 | 14.84 | 14.01 | 11.02 |
Cash Flow (Figures in Rs. Crores)
| Net Profit before Tax and Extr... | 2.33 |
| Depreciation | 0.34 |
| Interest (Net) | 0.31 |
| Total Adjustments (PBT and Ext... | 0.65 |
| Operating Profit before Workin... | 2.98 |
| Trade and 0ther Receivables | 0.31 |
| Inventories | -2.94 |
| Trade Payables | 1.28 |
| Loans and Advances | -6.65 |
| Change in Borrowing | 0.51 |
| Total Adjustments (OP before W... | -6.89 |
| Cash Generated from/(used in) ... | -3.91 |
| Direct Taxes Paid | -0.55 |
| Total Adjustments(Cash Generat... | -0.55 |
| Cash Flow before Extraordinary... | -4.46 |
| Net Cash from Operating Activi... | -4.46 |
| Purchased of Fixed Assets | -2.46 |
| Net Cash used in Investing Act... | -2.46 |
| Proceeds from Issue of shares ... | 7.86 |
| Of the Long Tem Borrowings | -0.59 |
| Interest Paid | -0.31 |
| Net Cash used in Financing Act... | 6.96 |
Company Details
Registered Office |
|
| Address | Plot# 502B Amara Jyothi Rd.#31, Jubilee Hills |
| City | Hyderabad |
| State | Telangana |
| Pin Code | 500033 |
| Tel. No. | +91 812 100 7731 |
| Fax. No. | |
| info@bikewo.in | |
| Internet | http://www.bikewo.in |
Registrars |
|
| Address | Plot# 502B Amara Jyothi Rd.#31 |
| City | Hyderabad |
| State | Telangana |
| Pin Code | 500033 |
| Tel. No. | +91 812 100 7731 |
| Fax. No. | |
| info@bikewo.in | |
| Internet | http://www.bikewo.in |
Management |
|
| Name | Designation |
| Katepalli Manideep | Chairman & Managing Director |
| RAMAMOHAN THAMMINENI | Whole Time Director |
| Taj Unnissa Begum | Non Executive Director |
| VARUN JAIN | Non Executive Director |
| Archana Devi Raj | Independent Director |
| Rajesh Pamarti | Independent Director |
| Jignesh Purshottam Bellani | Independent Director |
| Rakshita Agarwal | Company Sec. & Compli. Officer |


