Bharat Bond ETF - April 2032
NSE :BBETF0432 BSE :543418 Sector : ETFBuy, Sell or Hold BBETF0432? Ask The Analyst
BSE
prev close
OPEN PRICE
bid price (qty)
offer price (qty)
volume
Today's low / high
52 WK low / high
NSE
prev close
open price
bid price (qty)
offer price (qty)
volume
Today's' low / high
52 WK low / high
| 26 Apr 1135.96 (0.26%) | 25 Apr 1133.07 (-0.01%) | 24 Apr 1133.21 (-0.03%) | 23 Apr 1133.60 (0.10%) | 22 Apr 1132.51 (-0.32%) | 19 Apr 1136.13 (0.17%) | 18 Apr 1134.18 (-0.33%) | 16 Apr 1137.95 (-0.00%) | 15 Apr 1137.99 (-0.06%) | 12 Apr 1138.67 (0.07%) | 10 Apr 1137.89 (0.00%) | 09 Apr 1137.85 (0.01%) | 08 Apr 1137.68 (0.05%) | 05 Apr 1137.08 (0.03%) | 04 Apr 1136.73 (-0.20%) | 03 Apr 1138.96 (0.20%) | 02 Apr 1136.67 (-0.29%) | 01 Apr 1139.94 (0.24%) | 28 Mar 1137.25 (-0.07%) | 27 Mar 1138.10 (0.26%) | 26 Mar 1135.10 (-0.25%) |
Price Chart Historical Data Technical Chart
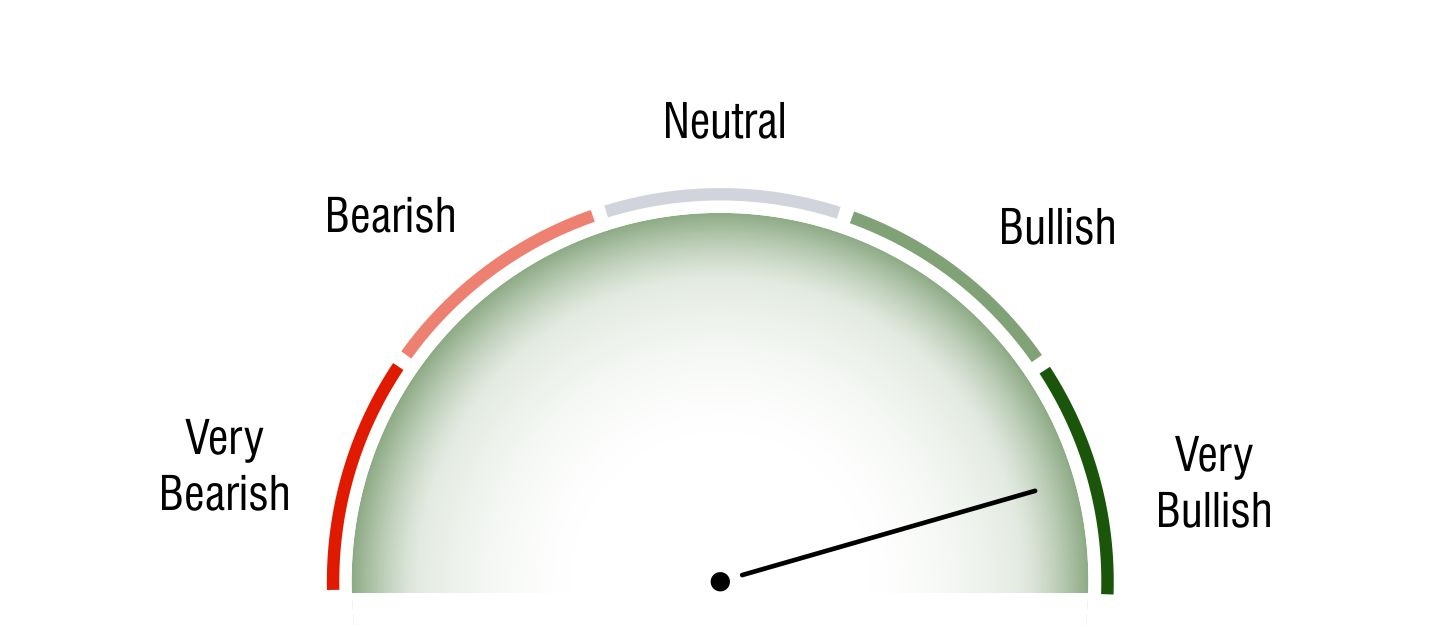
Technical Analysis
Short Term Investors

Neutral
Medium Term Investors

Bullish
Long Term Investors

Very Bullish
Moving Averages
5 DMA
Bearish
1137.54
10 DMA
Bearish
1137.14
20 DMA
Bearish
1134.46
50 DMA
Bullish
1124.2
100 DMA
Bullish
1108.24
200 DMA
Bullish
0
Intraday Support and Resistance
(Based on Pivot Points) |
Updated On Apr 26, 2024 04:00 PM For Next Trading Session
| Pivots | Classic | Fibonacci | Camarilla | Woodie | DM |
|---|---|---|---|---|---|
| R3 | 1139.82 | 1137.9 | 1136.75 | - | - |
| R2 | 1137.9 | 1136.8 | 1136.49 | 1138.14 | - |
| R1 | 1136.93 | 1136.11 | 1136.22 | 1137.41 | 1137.42 |
| P | 1135.01 | 1135.01 | 1135.01 | 1135.25 | 1135.25 |
| S1 | 1134.04 | 1133.91 | 1135.7 | 1134.52 | 1134.53 |
| S2 | 1132.12 | 1133.22 | 1135.43 | 1132.36 | - |
| S3 | 1131.15 | 1132.12 | 1135.17 | - | - |


