Download Unicorn Signals App

By EquityPandit

Latest News

India negotiating to buy 63 Rafale jets from France for $7.65 billion

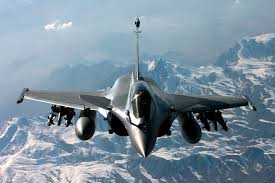
According to the french newspaper Le Monde, India is negotiating to buy 63 Rafale fighter jets which are made in France for 7.2 billion euros ($7.65 billion).

“The discussions went on through the night and were still going on this morning,” Le Monde quoted.

“The idea is to announce the contract during Indian Prime Minister Narendra Modi’s visit to Paris on Friday or Saturday, it added.

“It’s correct that discussions are under way, but a contract announcement is a bit of hype,” said one Indian official.

The Prime Minister Narendra Modi is in France for a two-day state visit and the idea was to announce the contract during the Prime Minister’s visit to the France capital.

Get Daily Prediction & Stocks Tips On Your Mobile


I would like to receive communication from EquityPandit via sms, email, whatsapp, Google RCS for offers, updates etc.
SBI

State Bank of India Outlook for the Week (July 31, 2023 – Aug 04, 2023)

Ali Waghbakriwala

Check State Bank Of India Full Analysis At Unicorn Signals

State Bank Of India Weekly Outlook and Analysis:

For the Week: (July 31, 2023 – Aug 04, 2023)

State Bank of India Outlook for the Week (July 31, 2023 – Aug 04, 2023)

BSE: 500112| NSE: SBIN| ISIN: INE062A01020| SECTOR: BANKS

State Bank Of India Share Price : 616.05 (NSE)

SBI closed the Weekly on Positive Note Gaining  0.15%

Weekly High: 621.90

Weekly Low: 604.20

Weekly Range: 17.70 points

Weekly Support & Resistance For SBIN:

RESISTANCE 2632
RESISTANCE 1624
SUPPORT 1606
SUPPORT 2596

Technically on the daily charts EquityPandit’s Analyst see: Minor support on the downside lies at 606 levels, Minor resistance on the upside is capped around 624 levels.

If stock breaches minor support on the downside and closes below it we may see fresh break down and stock can drag towards Major Support on lower side @ 596 and If stock breaches minor resistance on the upside and closes above it we may see fresh breakout and stock can head towards Major Resistances Level @ 632

Stock is trading above 200 days exponential moving average, suggests long term trend is bullish. EquityPandit’s Predicts Range for the Weekly as 632 on upside and 596 on downside.

SBI

State Bank Of India Outlook for the Week (03-JUL-2023 to 07-JUL-2023)

Chinmay Bohra

Check State Bank Of India Full Analysis At Unicorn Signals

State Bank Of India Weekly Outlook and Analysis:

For the Week: (July 03, 2023 – July 07, 2023)

State Bank Of India Outlook for the Week for the Week (July 03, 2023 – July 07, 2023)

BSE: 500112| NSE: SBIN| ISIN: INE062A01020| SECTOR: BANKS

State Bank Of India Share Price : 572.85 (NSE)

SBI closed the Weekly on Positive Note Gaining 3.29%

Weekly High: 574

Weekly Low: 554.50

Weekly Range: 19.50 points

Weekly Support & Resistance For Nifty Media:

RESISTANCE 2587
RESISTANCE 1580
SUPPORT 1560
SUPPORT 2548

Technically on the daily charts EquityPandit’s Analyst see: Minor support on the downside lies at 560 levels, Minor resistance on the upside is capped around 580 levels.

If stock breaches minor support on the downside and closes below it we may see fresh break down and stock can drag towards Major Support on lower side @ 548 and If stock breaches minor resistance on the upside and closes above it we may see fresh breakout and stock can head towards Major Resistances Level @ 587

Stock is trading above 200 days exponential moving average, suggests long term trend is bullish. EquityPandit’s Predicts Range for the Weekly as 587 on upside and 548 on downside.

SBI

State Bank Of India Outlook for the Week (26-JUN-2023 to 30-JUN-2023)

Chinmay Bohra

Check State Bank Of India Full Analysis At Unicorn Signals

State Bank Of India Weekly Outlook and Analysis:

For the Week: (June 26, 2023 – June 30, 2023)

State Bank Of India Outlook for the Week for the Week (June 26, 2023 – June 30, 2023)

BSE: 500112| NSE: SBIN| ISIN: INE062A01020| SECTOR: BANKS

State Bank Of India Share Price : 554.60 (NSE)

SBI closed the Weekly on Negative Note losing 2.91%

Weekly High: 572.75

Weekly Low: 533.80

Weekly Range: 38.95 points

Weekly Support & Resistance For Nifty Media:

RESISTANCE 2593
RESISTANCE 1574
SUPPORT 1535
SUPPORT 2515

Technically on the daily charts EquityPandit’s Analyst see: Minor support on the downside lies at 564 levels, Minor resistance on the upside is capped around 580 levels.

If stock breaches minor support on the downside and closes below it we may see fresh break down and stock can drag towards Major Support on lower side @ 556 and If stock breaches minor resistance on the upside and closes above it we may see fresh breakout and stock can head towards Major Resistances Level @ 589

Stock is trading beloe 200 days exponential moving average, suggests long term trend is bearish. EquityPandit’s Predicts Range for the Weekly as 589 on upside and 556 on downside.

SBI

State Bank Of India Outlook for the Week (19-JUN-2023 to 23-JUN-2023)

Chinmay Bohra

Check State Bank Of India Full Analysis At Unicorn Signals

State Bank Of India Weekly Outlook and Analysis:

For the Week: (June 19, 2023 – June 23, 2023)

State Bank Of India Outlook for the Week for the Week (June 19, 2023 – June 23, 2023)

BSE: 500112| NSE: SBIN| ISIN: INE062A01020| SECTOR: BANKS

State Bank Of India Share Price : 571.25 (NSE)

SBI closed the Weekly on Negative Note losing 1.29%

Weekly High: 581.50

Weekly Low: 565.25

Weekly Range: 16.25 points

Weekly Support & Resistance For Nifty Media:

RESISTANCE 2589
RESISTANCE 1580
SUPPORT 1564
SUPPORT 2556

Technically on the daily charts EquityPandit’s Analyst see: Minor support on the downside lies at 564 levels, Minor resistance on the upside is capped around 580 levels.

If stock breaches minor support on the downside and closes below it we may see fresh break down and stock can drag towards Major Support on lower side @ 556 and If stock breaches minor resistance on the upside and closes above it we may see fresh breakout and stock can head towards Major Resistances Level @ 589

Stock is trading above 200 days exponential moving average, suggests long term trend is bullish. EquityPandit’s Predicts Range for the Weekly as 589 on upside and 556 on downside.

SBI

State Bank OF India Outlook for the Week (05-JUN-2023 to 09-JUN-2023)

Nilesh

Check State Bank OF India Full Analysis at Unicorn Signals

State Bank of India Weekly Outlook and Analysis:

For the Week: (05-JUN-2023 to 09-JUN-2023)


BSE: 500112| NSE: SBIN| ISIN: INE062A01020| SECTOR: BANKS


State Bank Of India Share Price : 587.20 (NSE)


SBI closed the Weekly on Positive Note Gaining 0.20%


Weekly High: 596.40
Weekly Low: 577.50
Weekly Range: 18.90 points


Weekly Support & Resistance For SBIN:

RESISTANCE 2606
RESISTANCE 1597
SUPPORT 1578
SUPPORT 2568

Technically on the daily charts EquityPandit’s Analyst see: Minor support on the downside lies at 578 levels, Minor resistance on the upside is capped around 597 levels.


If stock breaches minor support on the downside and closes below it we may see fresh break down and stock can drag towards Major Support on lower side @ 568 and If stock breaches minor resistance on the upside and closes above it we may see fresh breakout and stock can head towards Major Resistances Level @ 606


Stock is trading above 200 days exponential moving average, suggests long term trend is bullish. EquityPandit’s Predicts Range for the Weekly as 606 on upside and 568 on downside.

Latest
IPO
Weekly
Outlook

Stock
Market
Prediction