Download Unicorn Signals App

By EquityPandit

Top Losers

Why HDFCLIFE Share Price dropped 4%? What’s news in stock?

HDFC Life Insurance Company Ltd

NSE :HDFCLIFE   BSE :540777  Sector : Insurance

About Company: HDFC Life Insurance Company is engaged in carrying on the business of life insurance. The Company offers a range of individual and group insurance solutions. The portfolio comprises of various insurance and investment products such as Protection, Pension, Savings

New in Stock: Standard Life (Mauritius Holdings) is to sell 7 crore, or about 3.46 percent of total shares of HDFC Life Insurance Company through block deals on June 29. The price range of the block deal book has been fixed at Rs.658 to 678 per share (5.8 percent-2.7 percent discount to the stock’s closing of Rs.696 on NSE on June 28).

JP Morgan India and BoFA Securities India are the joint bookrunners of the deal. The base offer size of the deal is Rs 4,606 crore at the lower end of the offer price range. As of the shareholding data available with BSE, Standard Life (Mauritius Holdings) held 17,95,39,209 shares, or 8.88 percent stake, of HDFC Life at the end of March quarter of FY21.

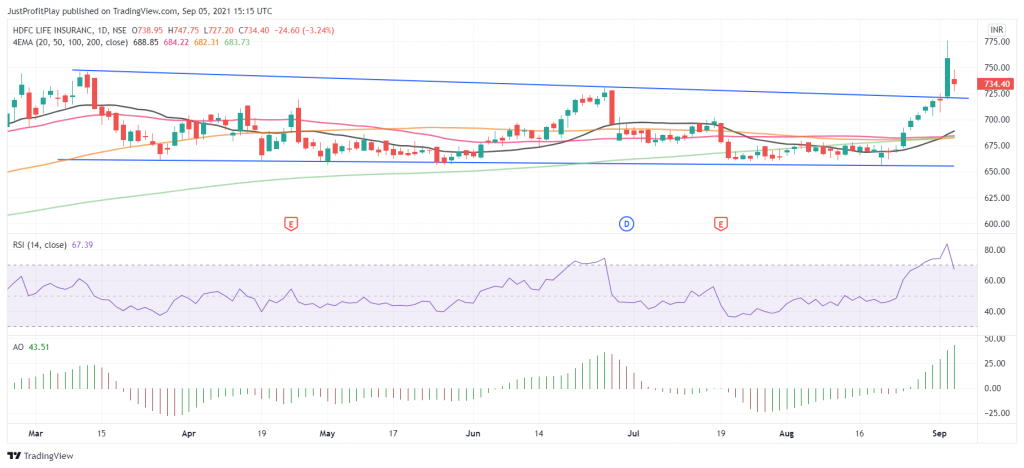
Daily Chart of HDFCLIFE:

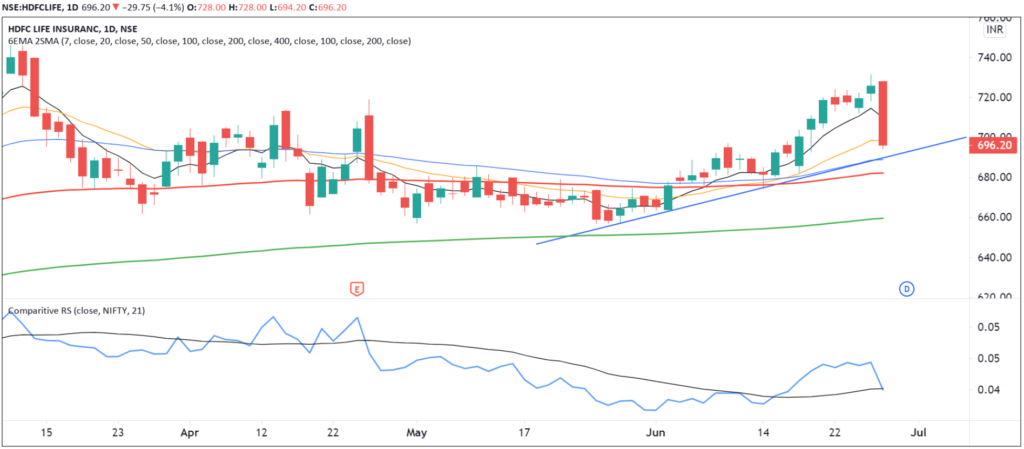
Technical Outlook of HDFCLIFE:

Stock closed at 696.20 on NSE. A correction of 4.1% was seen in Monday’s trading session. Stock today broke 10 and 20 Exponential moving averages which indicate the short term trend is negative and stock may see correction for the couple of trading sessions. Stock may find support around 688- 680 level around trendline support and 50 EMA. As overall trend for the stock is still up hence We suggest to buy stock on correction between 688- 680 for the targets 725- 740 with stop loss placed below 669 level on closing basis.

Get Daily Prediction & Stocks Tips On Your Mobile


I would like to receive communication from EquityPandit via sms, email, whatsapp, Google RCS for offers, updates etc.
Top Losers

IT Stocks Drags on Monday’s Trade. Tech Mahindra Leads the Pack losing 3.32%. What’s Ahead Now?

Prateek Gupta

Tech Mahindra Ltd

NSE :TECHM   BSE :532755  Sector : IT – Software

About Company: Tech Mahindra is a leading provider of consulting-led integrated portfolio services to customers which are Telecom Equipment Manufacturers, Telecom Service Providers and IT Infrastructure Service Providers, Business Process Outsourcing Service Providers as well as Enterprise Solutions Services (BFSI, Retail & Logistics, Manufacturing, Energy and Utility (E&U), and Healthcare, Life Sciences, etc.) of Information Technology (IT) and IT-enabled services delivered through a network of multiple locations around the globe. It also provides comprehensive range of IT services, including IT enabled services, application development and maintenance, consulting and enterprise business solutions, extended engineering solutions and infrastructure management services to a diversified base of corporate customers in a wide range of industries including insurance, banking and financial services, manufacturing, telecommunications, transportation and engineering services.

Technical Outlook of TechM:

Stock lost 3.32% today as profit booking was seen across the IT sector. But as far as technical Setup is concerned stock is still intact and up trending. Stock today took support at 10-Day EMA. Which provides to accumulate stock on correction. All the moving averages 10,20,50,100 are aligned in a linear pattern. We suggest short term traders to go long on stock 1475 for the targets of 1550, keep stop loss below 1418 level.

Top Losers

HDFC Life Insurance Stock 3.25% on Friday. Is this right time to Buy Stock?

Prateek Gupta

HDFC Life Insurance Company Ltd

NSE :HDFCLIFE   BSE :540777  Sector : Insurance

Technical Outlook on HDFCLIFE:

On Friday 03-Sept-2021, HDFC Life Insurance corrected 3.25% on NSE and closed at 734.40.

Stock on the Daily charts in trading above all Major exponential moving averages i.e. 10-20-50-100-200 which suggest long term and short term trend for the stock is still positive and there is more room for upside in the stock. As Stock broke trendline resistance on upside and now it will act as stock support for the stock

On Correction we recommend accumulating stock. For Short term traders stock is best buy around 715-725 level with stop loss placed below 700 and targets on the upside are 800- 850 in the next 30-60 Days.

Top Losers

Why GUJARAT GAS Stock Corrected 4.49% on Friday’s Trading Session?

Prateek Gupta

Gujarat Gas Ltd

NSE :GUJGASLTD   BSE :539336  Sector : Miscellaneous

About Company: Gujarat Gas Limited (GGL) is a government company u/s 2(45) of Companies Act 2013. Formerly Known as GSPC Distribution Networks Limited(GDNL), GGL is engaged in the business of Natural gas in India. The business of natural gas involves distribution of gas from sources of supply to centers of demand and to end customers. GGL caters to its customers by providing CNG and PNG connections in domestic, Industrial, Commercial and Non commercial segments in the areas of South & Central Gujarat and Saurashtra.

News in Stock: CLSA on Gujarat Gas: The brokerage has downgraded the stock to ‘sell’ from ‘outperform’, with a target price of Rs 690. Though the Q1 show was strong, the performance may be tough to repeat, according to CLSA.

Daily Chart of GUJGASLTD:

Technical Outlook of Gujrat Gas Limited:

Stock on Friday, Aug 07, 2021 closed at 737.40 losing 4.49% on NSE. After the brokerage firm CLSA down stock from Outperform to sell. Though technical indicators have shown no signs of weakness yet but stock looks over bought on daily charts and a healthy correction is needed for the stock.

Huge selling pressure on the stock prices has been seen which may further continue for the next few trading sessions. Stock may remain under pressure. We recommend traders and investors in the stock to book profits and again renter on lower levels around support at 690-680. Till then wait for the better opportunity in the stock and let the prices settle around supports.

HDFC BANKTop Losers

Here is Why HDFCBANK Share Prices Fall More Then 3% on Monday?

Prateek Gupta

HDFC Bank Ltd

NSE :HDFCBANK   BSE :500180  Sector : Banks

About Company: The Housing Development Finance Corporation Limited (HDFC) was amongst the first to receive an ‘in principle’ approval from the Reserve Bank of India (RBI) to set up a bank in the private sector. HDFC Bank is a publicly held banking company, the bank was incorporated in August 1994 in the name of ‘HDFC Bank Limited’, with its registered office in Mumbai, India. It is engaged in providing a range of banking and financial services including retail banking, wholesale banking and treasury operations. It is promoted by HDFC Ltd. which has 19.32% stake as on September 30, 2020. Currently, HDFC Bank Ltd. (HBL) is the largest private sector bank in India. As on March 31, 2020, the bank’s total balance sheet size stood at Rs. 15,30,511 Cr.

News in Stock: Today Stock corrected post Q1 FY22 Results announcement, HDFC Bank’s consolidated net profit for the June quarter increased 14 per cent to Rs 7,922 crore, but the largest private sector lender reported reverses because of the second wave of the pandemic which compressed its growth. When compared with the preceding March quarter’s Rs 8,434 crore, there was a decline in the consolidated profit.

Daily Chart of HDFCBANK:

Technical Outlook of HDFCBANK:

HDFCBANK stock corrected 3.37% and closed at 1471.00 on NSE. Gap down opening was seen in stock and slides more during intraday trading session. Heavy weight banking stock created pressure on the Bank Index. Today’s Q1 results announcement in HDFCBANK can hamper the market mood for the next few trading sessions. Stock was trading in an “upwards sloping channel pattern” as marked on the chart above. On the Flip side today on Monday 19th July 21 stock broke the channel pattern support and closed below it, but managed to close at 100 Days exponential moving average which lies at 1471. If stock sustains below 1471 in the next trading session stock can further slide to lower levels at 1455 and 1428, EquityPandit suggest swing traders to go short on the stock below 1465 for the targets of 1428 with stop loss placed above today’s highs 1488.85

Top Losers

Why Reliance shares ended in the red after AGM 2021? How will prices react going ahead?

Prateek Gupta

Reliance Industries Ltd

NSE :RELIANCE   BSE :500325  Sector : Refineries&Telecom

About Company: Reliance Industries Limited is a Fortune 500 company and the largest private sector corporation in India. It has evolved from being a textiles and polyester company to an integrated player across energy, materials, retail, entertainment and digital services. Reliance’s products and services portfolio touches almost all Indians on a daily basis, across economic and social spectrums.

Reliance was founded by Dhirubhai Ambani and is now promoted and managed by his elder son, Mukesh Dhirubhai Ambani. Ambani’s family have about 50% shareholding in the conglomerate.

Daily Chart Of Reliance Industries Limited (RIL):

News in Stock: Reliance Industries Limited was in News today on Thursday 24th June 2021 on 44th Reliance AGM. Here is the glimpse of Reliance 44th AGM:

  1. Saudi Aramco man joins RIL board. A deal with energy giant could happen this year.
  2. Google and Reliance develop Budget phone killer, Jio Phone Next. To be available from September 10. Price not confirmed but firms said it will be breakthrough.
  3. RIL will invest Rs.75,000 crore in its New Energy business over next three years. Will set up renewable energy complex and four giga factories.
  4. Jio working on 5G trials, will collaborate with Google Cloud for solutions, seen as first step towards made-in-India tech.
  5. Trials being done with Facebook for integrating Jio Mart and WhatsApp.

Investors were a little disappointed by the prevailing lack of clarity on Saudi Aramco’s stake purchase in the energy business but the real reason behind the fall was more likely the good old “buy the rumour, sell the news” trade.

What’s Ahead? Technical Outlook of Reliance Industries Limited (RIL):

Reliance Share prices corrected 2.35% and closed at 2153.50 on NSE. Stock broke out of “Wedge Price Pattern” on daily chart on June 1st, 2021 and headed higher, but today on Thursday 24th June 2021 again retested the breakout level which can act as strong support for the stock.

June series Future and Options expiry and AGM news were the main reason for the down moves in stock. Going ahead stock can resume it’s uptrend. Currently market seems to be approaching all time highs and heavy weight Reliance will move in synchronize with market. If in the next couple of trading session stock holds the level of 2130 we may see share prices heading higher towards all time high at 2369.35 and once all time high is breached the stock prices will enter uncharted territory and prices will be ready for explosive moves.

Latest
IPO
Weekly
Outlook

Stock
Market
Prediction