In the previous session, the market witnessed consolidation throughout the day. The index opened a gap up and remained in a sideways zone throughout the day. On the technical note, the index formed a small bearish candle on the chart and closed on a net profit of 38 points. Traders should be focused on sector and stock specific approach for the next trading day.
Look at the below research report of ‘Stocks to Buy for Wednesday, April 05,2023’ before the market opens.
HDFC Life Insurance Company Ltd

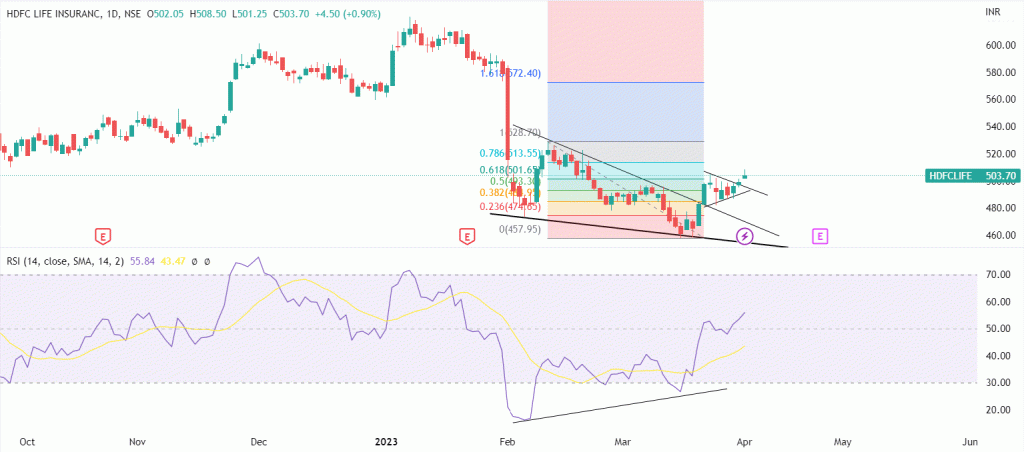
We have posted a daily chart of HDFCLIFE. We can see that the price has formed a ‘Falling Wedge’. It is a continuation pattern formed when price bounces between two downward sloping, converging trend lines. It is considered a bullish chart formation but can indicate both reversal and continuation patterns – depending on where it appears in the trend. Here this pattern has breakout and gives a signal to go up. Stock formed a Bullish candle on the chart and closed with a net gain of 0.90% . In addition , RSI is showing bullish divergence against the price, which is a positive sign.
The momentum on upside remains strong for HDFCLIFE. As it gives breakout of the falling wedge pattern hence we can expect it to reach a target of 513/528 levels .On downside stop loss can be placed below 493 level.
Check More Analysis on HDFCLIFE at: HDFC Life Insurance Company Ltd


