In the previous session, the market witnessed volatility throughout the day. Nifty index opened on a positive note and made a high of 17091.Later we saw some sell off from higher levels. Technically, the Nifty Index formed a Doji candle on the chart , which indicates indecision in the market. Hence a sock specific approach is advisable for the next trading day.
Look at the below research report of ‘Stocks to Buy for Tuesday, March 28,2023‘ before the market opens.
Grasim Industries Ltd

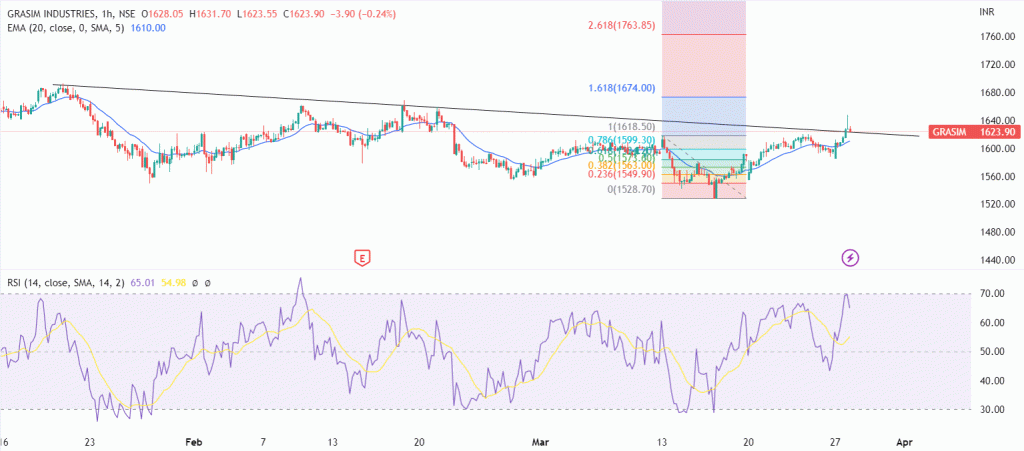
On the hourly chart, the stock has given a breakout above the trendline level indicating up move and offer fresh entry opportunity. As shown on the hourly chart stock comfortably closed above the 20 EMA support indicates short term bullishness. In addition, the Relative Strength Index (RSI) on the daily chart is 60 indicating strength in the stock.
In short, the trend for GRASIM looks to be positive for now. We can expect it to reach a target of 1674/1695 levels based on our analysis. This outlook is valid as long as we do not see any closing below 20 EMA levels.
Check More Analysis on GRASIM at: Grasim Industries Ltd
 Live
Live

