In the previous session, the market witnessed consolidation throughout the day. The index opened a gap up but soon slipped into a negative territory. Market remained in a sideways zone throughout the day. On the technical note, the index formed a small bullish candle on the chart and closed on a net profit of 44 points. Traders should be focused on sector and stock specific approach for the next trading day.
Look at the below research report of ‘Stocks to Buy for Thursday, March 23,2023’ before the market opens.
Abbott India Ltd

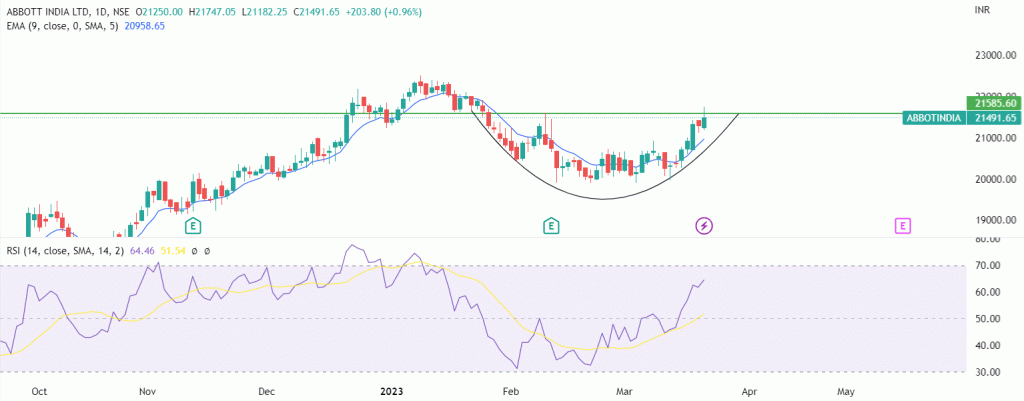
In the last trading day, stock formed a bullish candle on the daily chart. We can see the ‘Rounding Bottom Pattern’ has formed. It is a reversal chart pattern, also known as a Saucer pattern. This pattern is an indication of the end of the downtrend and the potential beginning of an uptrend. Price and volume are considered key indicators for identifying and confirming this pattern. Stock is now quoting near the neckline of the pattern. The Relative Strength Index (RSI) on the daily chart is 64 and it is moving above previous high.
In a Nutshell, the trend for ABBOTINDIA Ltd. looks to be positive now. one can initiate buy above 21594 which can take price towards 22505/23273levels. This outlook is valid as long as we do not see any closing below 9 EMA support.
Check More Analysis on ABBOTINDIA at: Abbott India Ltd
 Live
Live

