UCO Bank
NSE :UCOBANK BSE :532505 Sector : BanksBuy, Sell or Hold UCOBANK? Ask The Analyst
BSE
prev close
OPEN PRICE
volume
Today's low / high
52 WK low / high
bid price (qty)
offer price (qty)
NSE
prev close
open price
volume
Today's' low / high
52 WK low / high
bid price (qty)
offer price (qty)
| 11 Apr 28.94 (0.87%) | 09 Apr 28.69 (-0.69%) | 08 Apr 28.89 (2.96%) | 07 Apr 28.06 (-5.87%) | 04 Apr 29.81 (-1.88%) | 03 Apr 30.38 (1.13%) | 02 Apr 30.04 (-3.72%) | 01 Apr 31.20 (-12.61%) | 28 Mar 35.70 (-2.72%) | 27 Mar 36.70 (2.00%) | 26 Mar 35.98 (-1.53%) | 25 Mar 36.54 (-4.30%) | 24 Mar 38.18 (1.17%) | 21 Mar 37.74 (1.75%) | 20 Mar 37.09 (-0.70%) | 19 Mar 37.35 (3.38%) | 18 Mar 36.13 (3.11%) | 17 Mar 35.04 (-0.45%) | 13 Mar 35.20 (-1.35%) | 12 Mar 35.68 (-1.19%) | 11 Mar 36.11 (-0.52%) |
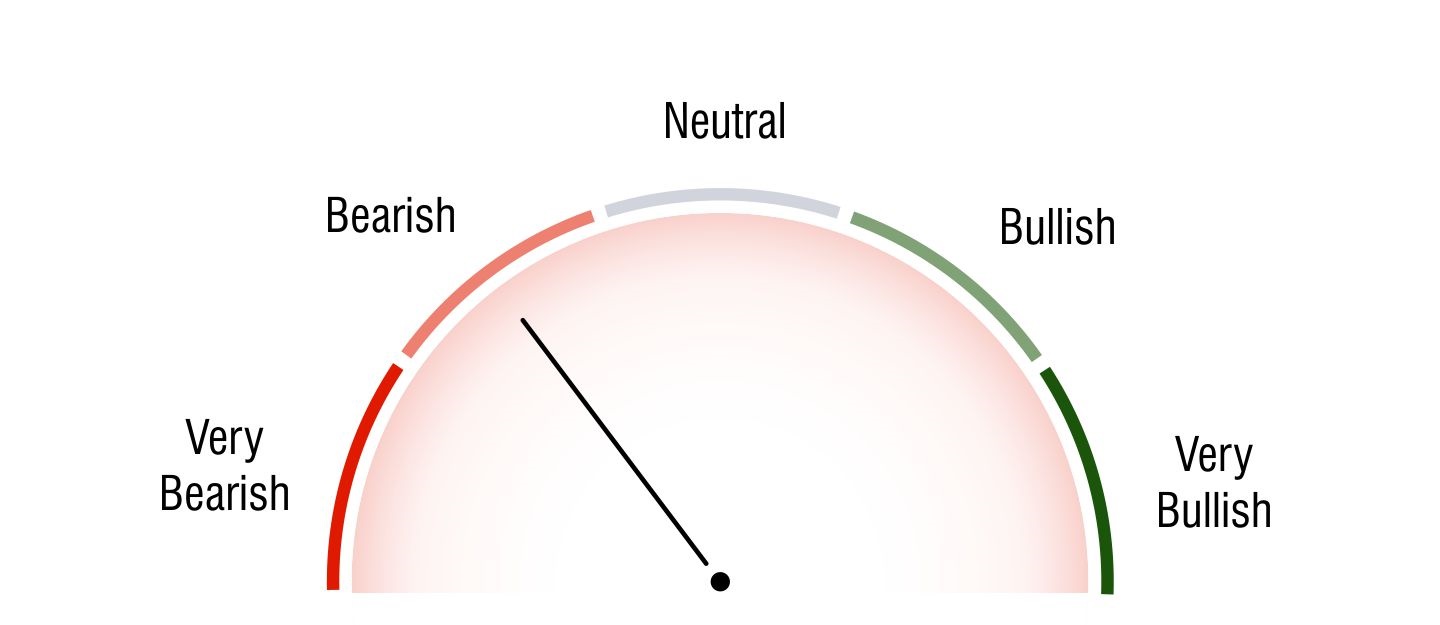
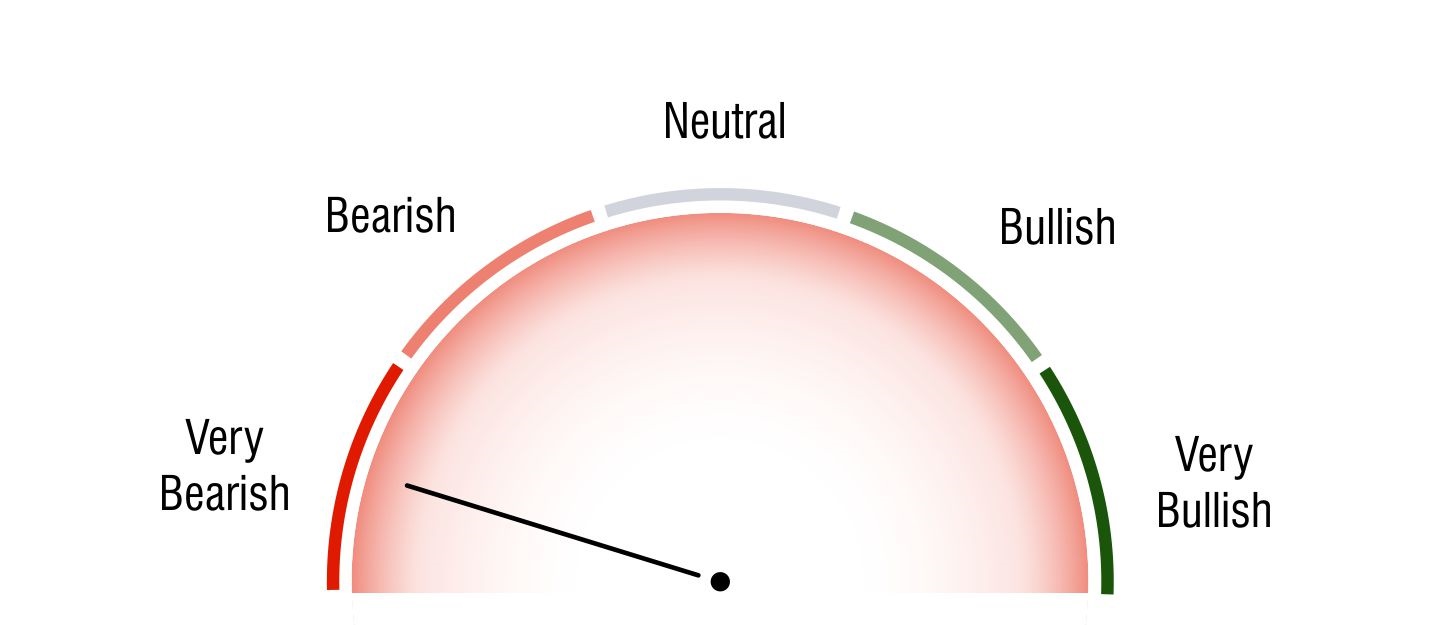
Technical Analysis
Short Term Investors

Bearish
Medium Term Investors

Very Bearish
Long Term Investors

Very Bearish
Moving Averages
5 DMA
Bullish
28.92
10 DMA
Bearish
30.87
20 DMA
Bearish
33.68
50 DMA
Bearish
37.09
100 DMA
Bearish
40.75
200 DMA
Bearish
45.38
Intraday Support and Resistance
(Based on Pivot Points) undefined |
Updated On Apr 11, 2025 04:00 PM For Next Trading Session
| Pivots | Classic | Fibonacci | Camarilla | Woodie | DM |
|---|---|---|---|---|---|
| R3 | 30.16 | 29.83 | 29.15 | - | - |
| R2 | 29.83 | 29.53 | 29.08 | 29.81 | - |
| R1 | 29.38 | 29.35 | 29.01 | 29.34 | 29.61 |
| P | 29.05 | 29.05 | 29.05 | 29.03 | 29.17 |
| S1 | 28.6 | 28.75 | 28.87 | 28.56 | 28.83 |
| S2 | 28.27 | 28.57 | 28.8 | 28.25 | - |
| S3 | 27.82 | 28.27 | 28.73 | - | - |
Key Metrics
EPS
1.85
P/E
15.66
P/B
1.31
Dividend Yield
0.92%
Market Cap
36,289 Cr.
Face Value
10
Book Value
22.04
ROE
7.03%
EBITDA Growth
4,837.46 Cr.
Debt/Equity
0
Shareholding History
Quarterly Result (Figures in Rs. Crores)
UCO Bank Quaterly Results
| Dec 2023 | Mar 2024 | Jun 2024 | Sep 2024 | Dec 2024 | ||
| INCOME | 6412.71 | 6984.61 | 6859.42 | 7071.43 | 7405.89 | |
| PROFIT | 505.23 | 537.86 | 555.3 | 606.8 | 640.16 | |
| EPS | 0.42 | 0.45 | 0.45 | 0.51 | 0.54 |
UCO Bank Quaterly Results
| Dec 2023 | Mar 2024 | Jun 2024 | Sep 2024 | Dec 2024 | ||
| INCOME | 6412.71 | 6984.61 | 6859.42 | 7071.43 | 7405.89 | |
| PROFIT | 502.83 | 525.77 | 550.96 | 602.74 | 638.83 | |
| EPS | 0.42 | 0.44 | 0.46 | 0.5 | 0.53 |
Profit & Loss (Figures in Rs. Crores)
UCO Bank Profit & Loss
| Mar 2021 | Mar 2022 | Mar 2023 | Mar 2024 | ||
| INCOME | 17870.32 | 18047.3 | 20158.98 | 25119.87 | |
| PROFIT | 89.05 | 929.49 | 1826.17 | 1671.19 | |
| EPS | 0.17 | 0.75 | 1.56 | 1.38 |
UCO Bank Profit & Loss
| Mar 2015 | Mar 2016 | Mar 2017 | Mar 2018 | Mar 2019 | Mar 2020 | Mar 2021 | Mar 2022 | Mar 2023 | Mar 2024 | ||
| INCOME | 21362.53 | 20157.28 | 18440.29 | 15141.13 | 15844.14 | 18005.54 | 17870.32 | 18082.15 | 20158.98 | 25119.87 | |
| PROFIT | 1137.27 | -2800.23 | -1851.02 | -4436.71 | -4330.57 | -2436.94 | 67.69 | 929.49 | 1862.23 | 1653.37 | |
| EPS | 10.18 | 0 | 0 | -19.22 | -7.97 | -2.46 | 0.17 | 0.78 | 1.56 | 1.38 |
Balance Sheet (Figures in Rs. Crores)
| Mar 2024 | Mar 2023 | Mar 2022 | Mar 2021 | |
| SOURCES OF FUNDS : | ||||
| Capital | 11,955.96 | 11,955.96 | 11,955.96 | 9,918.34 |
| Reserves Total | 15,257.83 | 13,647.74 | 11,512.78 | 9,998.16 |
| Equity Application Money | 0 | 0 | 0 | 2,600 |
| Deposits | 2,63,129.77 | 2,49,337.74 | 2,24,072.9 | 2,05,919.39 |
| Borrowings | 25,331.44 | 20,501.08 | 13,508.14 | 15,382.63 |
| Other Liabilities & Provisions | 7,873.45 | 5,259.66 | 6,609.48 | 9,427.67 |
| TOTAL LIABILITIES | 3,23,548.45 | 3,00,702.18 | 2,67,659.26 | 2,53,246.19 |
| APPLICATION OF FUNDS : | ||||
| Cash & Balances with RBI | 10,197.17 | 10,300.01 | 10,287.55 | 9,445.42 |
| Balances with Banks & money at Call | 18,828.19 | 18,428.09 | 15,860.44 | 14,154.83 |
| Investments | 92,761.4 | 95,008.54 | 96,749.05 | 93,693.04 |
| Advances | 1,82,021.87 | 1,55,870.18 | 1,22,784.41 | 1,11,354.54 |
| Fixed Assets | 3,781.47 | 3,509.51 | 3,334.92 | 3,218.23 |
| Other Assets | 15,958.36 | 17,585.85 | 18,642.9 | 21,380.14 |
| TOTAL ASSETS | 3,23,548.46 | 3,00,702.18 | 2,67,659.27 | 2,53,246.2 |
| Contingent Liabilities | 60,950.99 | 55,597.63 | 1,42,556.91 | 73,353.46 |
| Bills for collection | 8,001.36 | 8,184.43 | 8,039.45 | 7,109.67 |
| Mar 2024 | Mar 2023 | Mar 2022 | Mar 2021 | Mar 2020 | Mar 2019 | Mar 2018 | Mar 2017 | Mar 2016 | Mar 2015 | |
| SOURCES OF FUNDS : | ||||||||||
| Capital | 11,955.96 | 11,955.96 | 11,955.96 | 9,918.34 | 9,918.34 | 5,423.4 | 2,308.16 | 1,559.73 | 1,075.59 | 1,075.59 |
| Reserves Total | 15,400.83 | 13,808.55 | 11,637.54 | 10,088.07 | 9,291.28 | 8,370.97 | 7,517.02 | 10,043.74 | 10,511.36 | 11,473.36 |
| Equity Application Money | 0 | 0 | 0 | 2,600 | 0 | 3,596.68 | 5,132 | 1,150 | 935 | 0 |
| Deposits | 2,63,129.77 | 2,49,337.74 | 2,24,072.9 | 2,05,919.39 | 1,93,203.44 | 1,97,906.78 | 1,81,849.28 | 2,01,284.51 | 2,07,118.24 | 2,15,956.71 |
| Borrowings | 25,331.44 | 20,501.08 | 13,508.14 | 15,382.63 | 15,695.06 | 8,323.68 | 12,449.26 | 9,534.96 | 17,240.44 | 8,632.54 |
| Other Liabilities & Provisions | 7,873.45 | 5,259.66 | 6,609.48 | 9,427.67 | 7,800.02 | 6,862.57 | 6,999.78 | 7,917.65 | 8,050 | 9,136.61 |
| Total Liabilities | 3,23,691.45 | 3,00,862.99 | 2,67,784.02 | 2,53,336.1 | 2,35,908.14 | 2,30,484.08 | 2,16,255.5 | 2,31,490.59 | 2,44,930.63 | 2,46,274.81 |
| APPLICATION OF FUNDS : | ||||||||||
| Cash & Balances with RBI | 10,197.17 | 10,300.01 | 10,287.55 | 9,445.42 | 6,776.73 | 8,823.01 | 8,125.08 | 8,790.25 | 7,949.95 | 8,267.52 |
| Balances with Banks & money at Call | 18,828.19 | 18,428.09 | 15,860.44 | 14,154.83 | 11,029.43 | 15,609.09 | 6,622.96 | 9,309.63 | 10,609.28 | 13,901.45 |
| Investments | 92,904.4 | 95,169.35 | 96,873.8 | 93,782.95 | 90,998.81 | 82,231.69 | 70,962.15 | 74,019.12 | 83,974.2 | 64,223.05 |
| Advances | 1,82,021.87 | 1,55,870.18 | 1,22,784.41 | 1,11,354.54 | 1,01,174.25 | 99,313.84 | 1,07,470.02 | 1,19,724.45 | 1,25,905.37 | 1,47,350.87 |
| Fixed Assets | 3,781.47 | 3,509.51 | 3,334.92 | 3,218.23 | 2,840.37 | 2,822.31 | 2,875.1 | 2,849.48 | 2,884.64 | 1,114 |
| Other Assets | 15,958.36 | 17,585.85 | 18,642.9 | 21,380.14 | 23,088.55 | 21,684.13 | 20,200.2 | 16,797.66 | 13,607.19 | 11,417.93 |
| Total Assets | 3,23,691.46 | 3,00,862.99 | 2,67,784.02 | 2,53,336.11 | 2,35,908.14 | 2,30,484.07 | 2,16,255.51 | 2,31,490.59 | 2,44,930.63 | 2,46,274.82 |
| Contingent Liabilities | 60,950.99 | 55,597.63 | 1,42,556.91 | 73,353.46 | 39,082.16 | 87,384.98 | 1,23,488.03 | 51,804.24 | 59,340.45 | 74,826.11 |
| Bills for collection | 8,001.36 | 8,184.43 | 8,039.45 | 7,109.67 | 7,822.35 | 8,538.84 | 8,837.8 | 6,644.41 | 6,908.15 | 5,665.49 |
Cash Flow (Figures in Rs. Crores)
| Net Profit before Tax and Extr... | 2,586.66 |
| Depreciation | 621.92 |
| Interest (Net) | 187.09 |
| Dividend Received | 4.05 |
| P/L on Sales of Assets | -0.58 |
| Prov. and W/O (Net) | 2,321.12 |
| Total Adjustments (PBT and Ext... | 3,125.5 |
| Operating Profit before Workin... | 5,712.17 |
| Loans and Advances | -27,219.96 |
| Investments | 1,906.14 |
| Change in Borrowing | 4,738.04 |
| Change in Deposits | 13,792.04 |
| Total Adjustments (OP before W... | -4,710.42 |
| Cash Generated from/(used in) ... | 1,001.75 |
| Cash Flow before Extraordinary... | 1,001.75 |
| Net Cash from Operating Activi... | 1,001.75 |
| Purchased of Fixed Assets | -353.62 |
| Sale of Fixed Assets | 54.66 |
| Net Cash used in Investing Act... | -274.96 |
| On Redemption of Debenture | -47.5 |
| Of the Long Tem Borrowings | -242.45 |
| Interest Paid | -139.59 |
| Net Cash used in Financing Act... | -429.53 |
| Net Profit before Tax and Extr... | 2,568.85 |
| Depreciation | 280.92 |
| Interest (Net) | 187.09 |
| Dividend Received | 4.05 |
| P/L on Sales of Assets | -0.58 |
| Prov. and W/O (Net) | 2,662.12 |
| Total Adjustments (PBT and Ext... | 3,125.5 |
| Operating Profit before Workin... | 5,694.36 |
| Loans and Advances | -27,219.96 |
| Investments | 1,923.95 |
| Change in Borrowing | 4,738.04 |
| Change in Deposits | 13,792.04 |
| Total Adjustments (OP before W... | -4,692.61 |
| Cash Generated from/(used in) ... | 1,001.75 |
| Cash Flow before Extraordinary... | 1,001.75 |
| Net Cash from Operating Activi... | 1,001.75 |
| Purchased of Fixed Assets | -353.62 |
| Sale of Fixed Assets | 54.66 |
| Net Cash used in Investing Act... | -274.96 |
| On Redemption of Debenture | -47.5 |
| Of the Long Tem Borrowings | -242.45 |
| Interest Paid | -139.59 |
| Net Cash used in Financing Act... | -429.53 |
Company Details
Registered Office |
|
| Address | 10 B T M Sarani, 7th Floor |
| City | Kolkata |
| State | West Bengal |
| Pin Code | 700001 |
| Tel. No. | 91-33-22254120/29 |
| Fax. No. | 91-33-22485625 |
| hosgr.calcutta@ucobank.co.in; hoacs.calcutta@ucoba | |
| Internet | http://www.ucobank.com |
Registrars |
|
| Address | 10 B T M Sarani |
| City | Kolkata |
| State | West Bengal |
| Pin Code | 700001 |
| Tel. No. | 91-33-22254120/29 |
| Fax. No. | 91-33-22485625 |
| hosgr.calcutta@ucobank.co.in; hoacs.calcutta@ucoba | |
| Internet | http://www.ucobank.com |
Management |
|
| Name | Designation |
| Rajesh Kumar | Nominee (RBI) |
| Sanjay Kumar | Nominee (Govt) |
| Rajendra Kumar Saboo | Executive Director |
| Subhash Shankar Malik | Part Time Non Official Ind.Dir |
| Vikash Gupta | Company Sec. & Compli. Officer |
| Aravamudan Krishana Kumar | Chairman (Non-Executive) |
| Ashwani Kumar | Managing Director & CEO |
| Vijaykumar Nivrutti Kamble | Executive Director |
| Rachna Khare | Director (Shareholder) |


