The Reserve Bank of India (RBI) on Wednesday extended realisation period of export proceeds as part of additional measures to deal with the economic disruption caused by coronavirus epidemic. The value of the goods or software exports made by exporters is currently required to be realised fully and repatriated to the country within nine months from the date of exports.
“Given the disruption caused by the COVID-19 pandemic, the period for realisation and repatriation of export proceeds for exports made up to or on July 31 has been extended to 15 months from the date of export,” the RBI said in a statement.
The measure will enable exporters to realise their receipts, especially from COVID-19 affected countries, within the extended period and also provide greater flexibility to exporters to negotiate future export contracts with buyers abroad, it added.
Besides, the central bank had constituted an advisory committee under the chairmanship of Sudhir Shrivastava to review ways and means limits for state governments and Union territories.
Read EquityPandit’s Nifty Bank Outlook for the Week

Dr. Reddy Outlook for the Week (April 03, 2023 – April 07, 2023)
Check DRREDDY Full Analysis At Unicorn Signals
DRREDDY Weekly Outlook and Analysis:
For the Week: (April 03, 2023 – April 07, 2023)
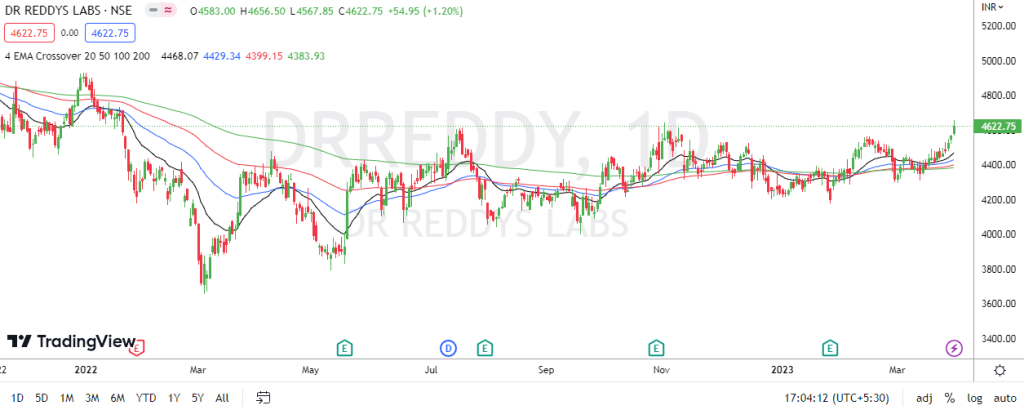
BSE: 500180| NSE: DRREDDY| ISIN: INE040A01026| SECTOR: PHARMA
Stock closed the Weekly on positive note gaining 3.55%
Dr Reddy Share Price: 4622.75
Weekly High: 4656.50
Weekly Low: 4465.05
Weekly Range: 158.60 Points
Weekly Support & Resistance For DR. Reddy:
| RESISTANCE 2 | 4772 |
| RESISTANCE 1 | 4697 |
| SUPPORT 1 | 4506 |
| SUPPORT 2 | 4390 |
Technically on the daily charts EquityPandit’s Analyst see: Minor support on the downside lies at 4506 levels, Minor resistance on the upside is capped around 4697 levels.
If stock breaches minor support on the downside and closes below it we may see fresh break down and stock can drag towards Major Support on lower side @ 4390 and If stock breaches minor resistance on the upside and closes above it we may see fresh breakout and stock can head towards Major Resistances Level @ 4772.
Stock is trading above 200 days exponential moving average, suggests long term trend is bullish. EquityPandit predicts Range for the Weekly as 4772 on upside and 4390 on downside.
Dr. Reddy Outlook for the Week (Mar 27, 2023 – March 31, 2023)
Check DRREDDY Full Analysis At Unicorn Signals
DRREDDY Weekly Outlook and Analysis:
For the Week: (Mar 27, 2023 – March 31, 2023)
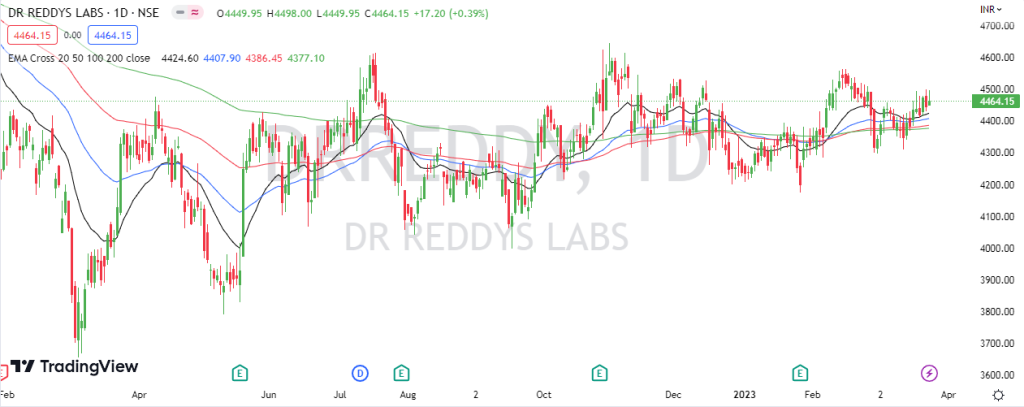
BSE: 500180| NSE: DRREDDY| ISIN: INE040A01026| SECTOR: PHARMA
Stock closed the Weekly on positive note gaining 0.63%
Dr Reddy Share Price: 4464.15
Weekly High: 4499.50
Weekly Low: 4309.20
Weekly Range: 28.00 Points
Weekly Support & Resistance For DR. Reddy:
| RESISTANCE 2 | 4547 |
| RESISTANCE 1 | 4505 |
| SUPPORT 1 | 4415 |
| SUPPORT 2 | 4367 |
Technically on the daily charts EquityPandit’s Analyst see: Minor support on the downside lies at 4415 levels, Minor resistance on the upside is capped around 4505 levels.
If stock breaches minor support on the downside and closes below it we may see fresh break down and stock can drag towards Major Support on lower side @ 4367 and If stock breaches minor resistance on the upside and closes above it we may see fresh breakout and stock can head towards Major Resistances Level @ 4547.
Stock is trading above 200 days exponential moving average, suggests long term trend is bullish. EquityPandit predicts Range for the Weekly as 4547 on upside and 4367 on downside.
Dr. Reddy Outlook for the Week (Mar 20, 2023 – March 24, 2023)
Check DRREDDY Full Analysis At Unicorn Signals
DRREDDY Weekly Outlook and Analysis:
For the Week: (Mar 20, 2023 – March 24, 2023)
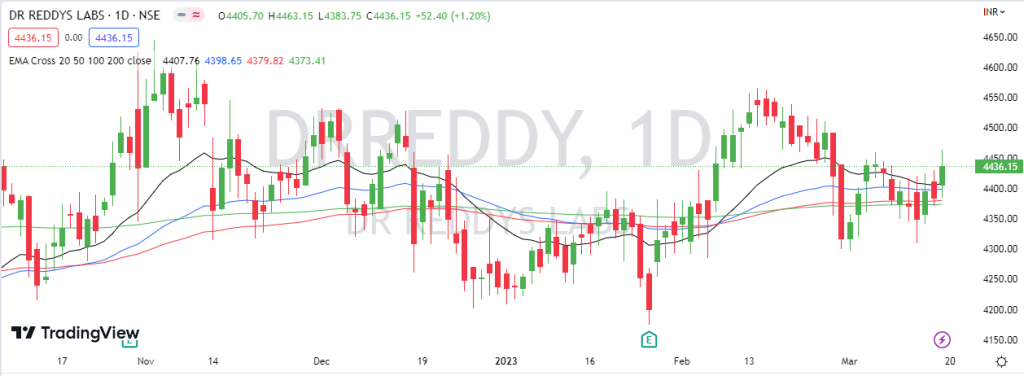
BSE: 500180| NSE: DRREDDY| ISIN: INE040A01026| SECTOR: PHARMA
Stock closed the Weekly on positive note gaining 0.92%
Dr Reddy Share Price: 4436.15
Weekly High: 4463.15
Weekly Low: 4309
Weekly Range: 40.60 Points
Weekly Support & Resistance For DR. Reddy:
| RESISTANCE 2 | 4526 |
| RESISTANCE 1 | 4496 |
| SUPPORT 1 | 4342 |
| SUPPORT 2 | 4248 |
Technically on the daily charts EquityPandit’s Analyst see: Minor support on the downside lies at 4342 levels, Minor resistance on the upside is capped around 4496 levels.
If stock breaches minor support on the downside and closes below it we may see fresh break down and stock can drag towards Major Support on lower side @ 4248 and If stock breaches minor resistance on the upside and closes above it we may see fresh breakout and stock can head towards Major Resistances Level @ 4526.
Stock is trading above 200 days exponential moving average, suggests long term trend is bullish. EquityPandit predicts Range for the Weekly as 4526 on upside and 4248 on downside.
Dr. Reddy Outlook for the Week (Mar 13, 2023 – March 17, 2023)
Check DRREDDY Full Analysis At Unicorn Signals
DRREDDY Weekly Outlook and Analysis:
For the Week: (Mar 13, 2023 – March 17, 2023)
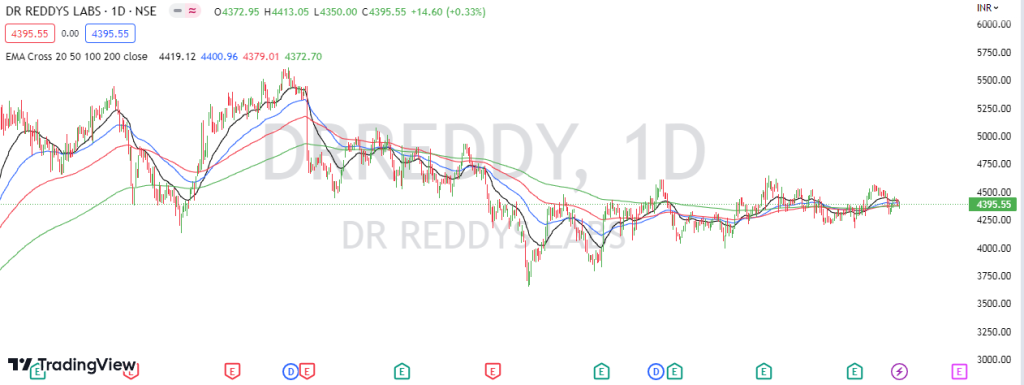
BSE: 500180| NSE: DRREDDY| ISIN: INE040A01026| SECTOR: PHARMA
Stock closed the Weekly on negative note loosing 0.96%
Dr Reddy Share Price: 4395.55
Weekly High: 4458.80
Weekly Low: 4350.00
Weekly Range: 42.40 Points
Weekly Support & Resistance For DR. Reddy:
| RESISTANCE 2 | 4509 |
| RESISTANCE 1 | 4452 |
| SUPPORT 1 | 4344 |
| SUPPORT 2 | 4293 |
Technically on the daily charts EquityPandit’s Analyst see: Minor support on the downside lies at 4344 levels, Minor resistance on the upside is capped around 4452 levels.
If stock breaches minor support on the downside and closes below it we may see fresh break down and stock can drag towards Major Support on lower side @ 4293 and If stock breaches minor resistance on the upside and closes above it we may see fresh breakout and stock can head towards Major Resistances Level @ 4509.
Stock is trading on 200 days exponential moving average, suggests long term trend is nutral. EquityPandit predicts Range for the Weekly as 4509 on upside and 4293 on downside.
Dr. Reddy Outlook for the Week (Jan 30, 2023 – Feb 03, 2023)
Check DRREDDY Full Analysis At Unicorn Signals
DRREDDY Weekly Outlook and Analysis:
For the Week: (Jan 30, 2023 – Feb 03, 2023)
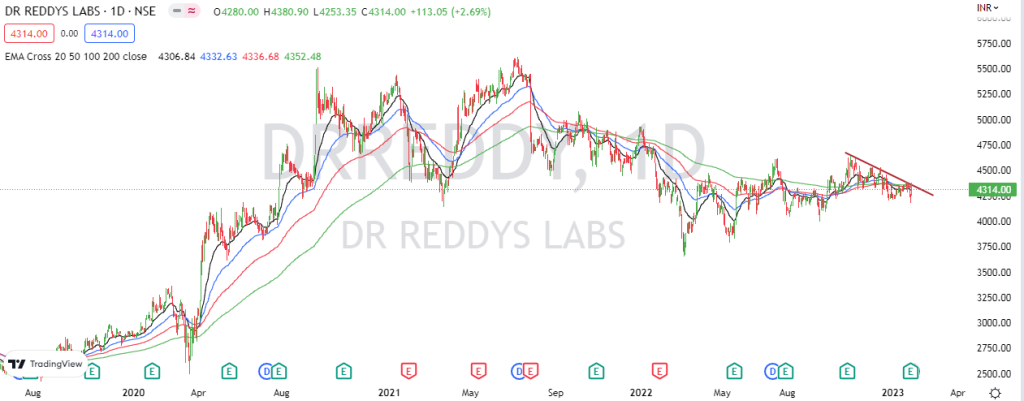
Check DRREDDY Full Analysis At Unicorn Signals
BSE: 500180| NSE: DRREDDY| ISIN: INE040A01026| SECTOR: PHARMA
Stock closed the Weekly on negative note loosing 0.84%
Dr Reddy Share Price: 4314.00
Weekly High: 4380.90
Weekly Low: 4175.10
Weekly Range: 36.60 Points
Weekly Support & Resistance For DR. Reddy:
| RESISTANCE 2 | 4494 |
| RESISTANCE 1 | 4404 |
| SUPPORT 1 | 4199 |
| SUPPORT 2 | 4084 |
Technically on the daily charts EquityPandit’s Analyst see: Minor support on the downside lies at 4199 levels, Minor resistance on the upside is capped around 4404 levels.
If stock breaches minor support on the downside and closes below it we may see fresh break down and stock can drag towards Major Support on lower side @ 4084 and If stock breaches minor resistance on the upside and closes above it we may see fresh breakout and stock can head towards Major Resistances Level @ 4494.
Stock is trading below 200 days exponential moving average, suggests long term trend is bearish. EquityPandit predicts Range for the Weekly as 4494 on upside and 4084 on downside.


