In the early Asian trading session, oil was little changed as investors weigh weak near-term fuel demand due to the tightened pandemic restrictions against distribution of vaccines in some regions.
Oil Futures were traded nearly at $47 a barrel after soaring 0.9 per cent on Monday. New York is heading towards second lockdown after a surge in number of coronavirus cases, while London will be having England’s toughest restrictions from Wednesday. The tighter pandemic restrictions come as the US had started delivering its first batch of Covid-19 vaccines.
Meanwhile, OPEC (Organization of Petroleum Countries) cuts its projected oil demand level for the first quarter of the coming year as OPEC+ group, which includes the OPEC, Russia, and other allies has decided to increase the crude oil production by 500,000 barrels per day from January.
On January 4, OPEC+ will held its meeting to further consider any possible cut in the increased monthly supplies although a report from the group on Monday suggests that it can incrementally restore production level over the next quarter without increasing supply in the market.
Dr. Reddy Outlook for the Week (April 03, 2023 – April 07, 2023)
Check DRREDDY Full Analysis At Unicorn Signals
DRREDDY Weekly Outlook and Analysis:
For the Week: (April 03, 2023 – April 07, 2023)
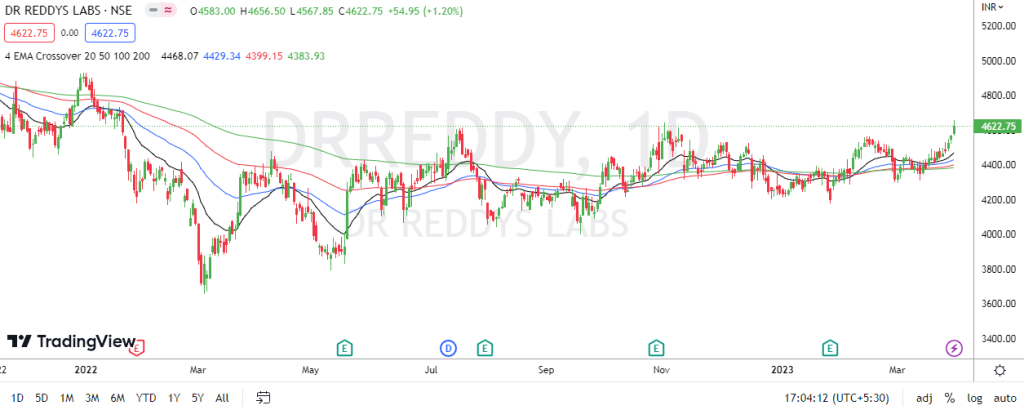
BSE: 500180| NSE: DRREDDY| ISIN: INE040A01026| SECTOR: PHARMA
Stock closed the Weekly on positive note gaining 3.55%
Dr Reddy Share Price: 4622.75
Weekly High: 4656.50
Weekly Low: 4465.05
Weekly Range: 158.60 Points
Weekly Support & Resistance For DR. Reddy:
| RESISTANCE 2 | 4772 |
| RESISTANCE 1 | 4697 |
| SUPPORT 1 | 4506 |
| SUPPORT 2 | 4390 |
Technically on the daily charts EquityPandit’s Analyst see: Minor support on the downside lies at 4506 levels, Minor resistance on the upside is capped around 4697 levels.
If stock breaches minor support on the downside and closes below it we may see fresh break down and stock can drag towards Major Support on lower side @ 4390 and If stock breaches minor resistance on the upside and closes above it we may see fresh breakout and stock can head towards Major Resistances Level @ 4772.
Stock is trading above 200 days exponential moving average, suggests long term trend is bullish. EquityPandit predicts Range for the Weekly as 4772 on upside and 4390 on downside.
Dr. Reddy Outlook for the Week (Mar 27, 2023 – March 31, 2023)
Check DRREDDY Full Analysis At Unicorn Signals
DRREDDY Weekly Outlook and Analysis:
For the Week: (Mar 27, 2023 – March 31, 2023)
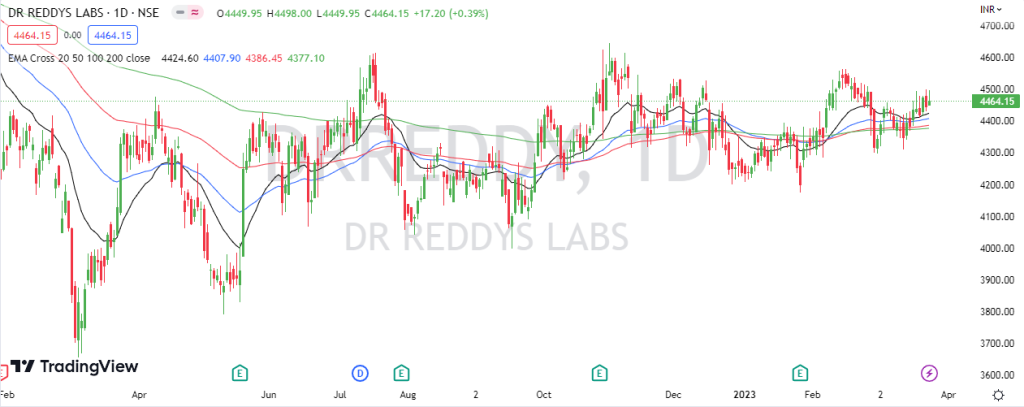
BSE: 500180| NSE: DRREDDY| ISIN: INE040A01026| SECTOR: PHARMA
Stock closed the Weekly on positive note gaining 0.63%
Dr Reddy Share Price: 4464.15
Weekly High: 4499.50
Weekly Low: 4309.20
Weekly Range: 28.00 Points
Weekly Support & Resistance For DR. Reddy:
| RESISTANCE 2 | 4547 |
| RESISTANCE 1 | 4505 |
| SUPPORT 1 | 4415 |
| SUPPORT 2 | 4367 |
Technically on the daily charts EquityPandit’s Analyst see: Minor support on the downside lies at 4415 levels, Minor resistance on the upside is capped around 4505 levels.
If stock breaches minor support on the downside and closes below it we may see fresh break down and stock can drag towards Major Support on lower side @ 4367 and If stock breaches minor resistance on the upside and closes above it we may see fresh breakout and stock can head towards Major Resistances Level @ 4547.
Stock is trading above 200 days exponential moving average, suggests long term trend is bullish. EquityPandit predicts Range for the Weekly as 4547 on upside and 4367 on downside.
Dr. Reddy Outlook for the Week (Mar 20, 2023 – March 24, 2023)
Check DRREDDY Full Analysis At Unicorn Signals
DRREDDY Weekly Outlook and Analysis:
For the Week: (Mar 20, 2023 – March 24, 2023)
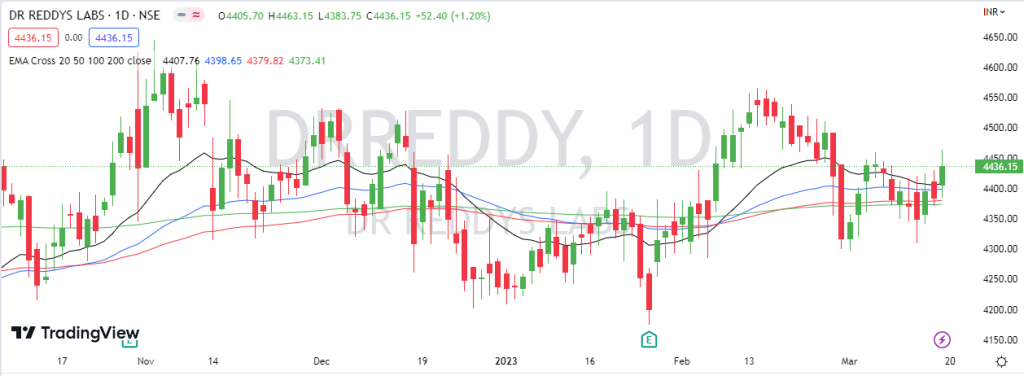
BSE: 500180| NSE: DRREDDY| ISIN: INE040A01026| SECTOR: PHARMA
Stock closed the Weekly on positive note gaining 0.92%
Dr Reddy Share Price: 4436.15
Weekly High: 4463.15
Weekly Low: 4309
Weekly Range: 40.60 Points
Weekly Support & Resistance For DR. Reddy:
| RESISTANCE 2 | 4526 |
| RESISTANCE 1 | 4496 |
| SUPPORT 1 | 4342 |
| SUPPORT 2 | 4248 |
Technically on the daily charts EquityPandit’s Analyst see: Minor support on the downside lies at 4342 levels, Minor resistance on the upside is capped around 4496 levels.
If stock breaches minor support on the downside and closes below it we may see fresh break down and stock can drag towards Major Support on lower side @ 4248 and If stock breaches minor resistance on the upside and closes above it we may see fresh breakout and stock can head towards Major Resistances Level @ 4526.
Stock is trading above 200 days exponential moving average, suggests long term trend is bullish. EquityPandit predicts Range for the Weekly as 4526 on upside and 4248 on downside.
Dr. Reddy Outlook for the Week (Mar 13, 2023 – March 17, 2023)
Check DRREDDY Full Analysis At Unicorn Signals
DRREDDY Weekly Outlook and Analysis:
For the Week: (Mar 13, 2023 – March 17, 2023)
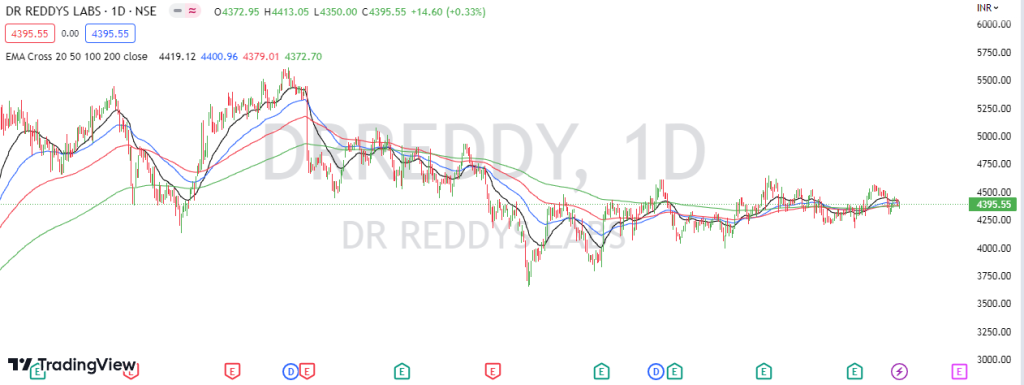
BSE: 500180| NSE: DRREDDY| ISIN: INE040A01026| SECTOR: PHARMA
Stock closed the Weekly on negative note loosing 0.96%
Dr Reddy Share Price: 4395.55
Weekly High: 4458.80
Weekly Low: 4350.00
Weekly Range: 42.40 Points
Weekly Support & Resistance For DR. Reddy:
| RESISTANCE 2 | 4509 |
| RESISTANCE 1 | 4452 |
| SUPPORT 1 | 4344 |
| SUPPORT 2 | 4293 |
Technically on the daily charts EquityPandit’s Analyst see: Minor support on the downside lies at 4344 levels, Minor resistance on the upside is capped around 4452 levels.
If stock breaches minor support on the downside and closes below it we may see fresh break down and stock can drag towards Major Support on lower side @ 4293 and If stock breaches minor resistance on the upside and closes above it we may see fresh breakout and stock can head towards Major Resistances Level @ 4509.
Stock is trading on 200 days exponential moving average, suggests long term trend is nutral. EquityPandit predicts Range for the Weekly as 4509 on upside and 4293 on downside.
Dr. Reddy Outlook for the Week (Jan 30, 2023 – Feb 03, 2023)
Check DRREDDY Full Analysis At Unicorn Signals
DRREDDY Weekly Outlook and Analysis:
For the Week: (Jan 30, 2023 – Feb 03, 2023)
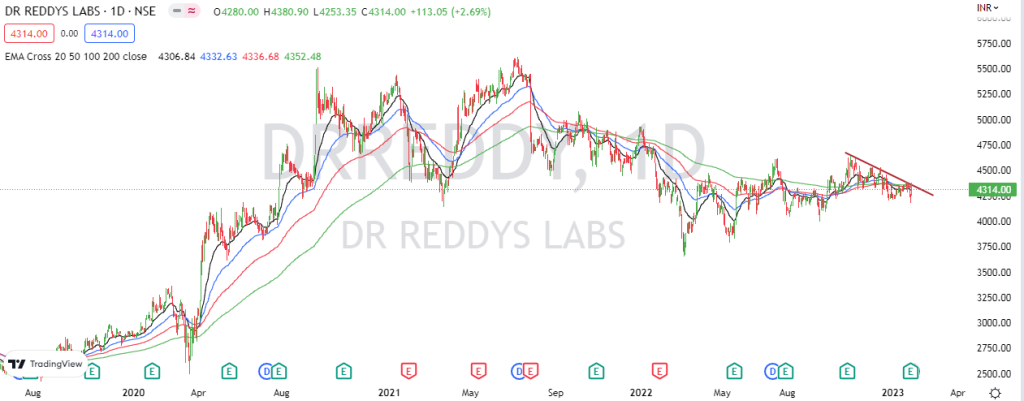
Check DRREDDY Full Analysis At Unicorn Signals
BSE: 500180| NSE: DRREDDY| ISIN: INE040A01026| SECTOR: PHARMA
Stock closed the Weekly on negative note loosing 0.84%
Dr Reddy Share Price: 4314.00
Weekly High: 4380.90
Weekly Low: 4175.10
Weekly Range: 36.60 Points
Weekly Support & Resistance For DR. Reddy:
| RESISTANCE 2 | 4494 |
| RESISTANCE 1 | 4404 |
| SUPPORT 1 | 4199 |
| SUPPORT 2 | 4084 |
Technically on the daily charts EquityPandit’s Analyst see: Minor support on the downside lies at 4199 levels, Minor resistance on the upside is capped around 4404 levels.
If stock breaches minor support on the downside and closes below it we may see fresh break down and stock can drag towards Major Support on lower side @ 4084 and If stock breaches minor resistance on the upside and closes above it we may see fresh breakout and stock can head towards Major Resistances Level @ 4494.
Stock is trading below 200 days exponential moving average, suggests long term trend is bearish. EquityPandit predicts Range for the Weekly as 4494 on upside and 4084 on downside.


