Download Unicorn Signals App

By EquityPandit

Latest News

Uber to expand services to 100 Chinese cities

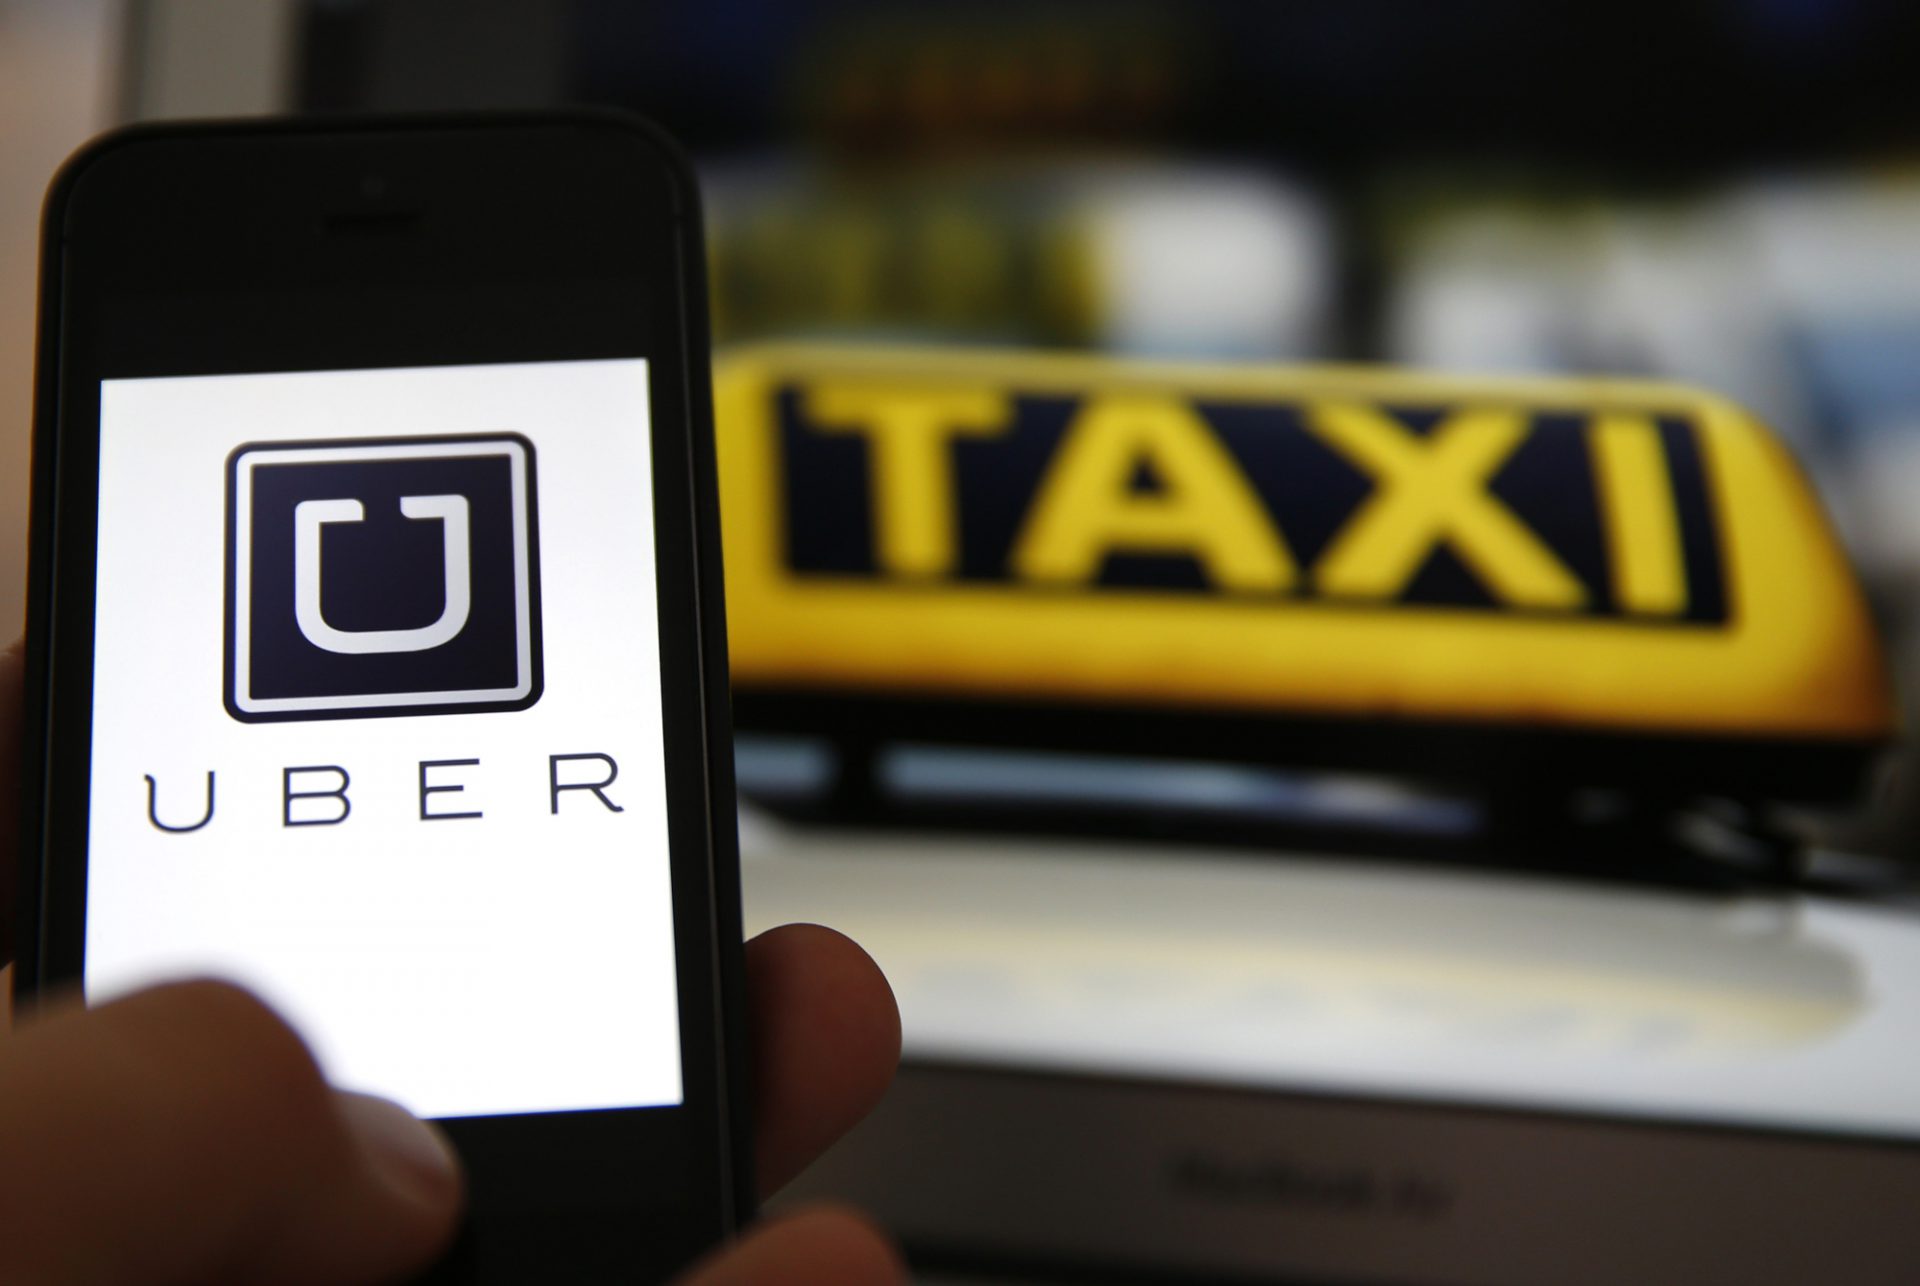
Uber said on Thursday that within a year, it is planning to expand into dozens more Chinese cities and invest $1 billion to increase the market share in the world’s most populous country.

Uber said in a statement that it has entered China in February 2014, and will expand its operation into 100 Chinese cities within a year from the current 21.

It will be investing up to 6.3 billion yuan ($1 billion) in China in a bid to increase its presence in the country and set up in Shanghai’s Free Trade Zone.

Read EquityPandit’s Technical Analysis on CNX Auto

Get Daily Prediction & Stocks Tips On Your Mobile


I would like to receive communication from EquityPandit via sms, email, whatsapp, Google RCS for offers, updates etc.
DR REDDY

Dr. Reddy Outlook for the Week (April 03, 2023 – April 07, 2023)

Prateek Gupta

Check DRREDDY Full Analysis At Unicorn Signals

DRREDDY Weekly Outlook and Analysis:

For the Week: (April 03, 2023 – April 07, 2023)

Dr. Reddy Outlook for the Week (April 03, 2023 – April 07, 2023)

BSE: 500180| NSE: DRREDDY| ISIN: INE040A01026| SECTOR: PHARMA

Stock closed the Weekly on positive note gaining 3.55%

Dr Reddy Share Price: 4622.75                 

Weekly High: 4656.50

Weekly Low: 4465.05

Weekly Range: 158.60 Points

Weekly Support & Resistance For DR. Reddy:

RESISTANCE 24772
RESISTANCE 14697
SUPPORT 14506
SUPPORT 24390
Dr. Reddy Outlook for the Week (April 03, 2023 – April 07, 2023)

Technically on the daily charts EquityPandit’s Analyst see: Minor support on the downside lies at 4506 levels, Minor resistance on the upside is capped around 4697 levels.

If stock breaches minor support on the downside and closes below it we may see fresh break down and stock can drag towards Major Support on lower side @ 4390 and If stock breaches minor resistance on the upside and closes above it we may see fresh breakout and stock can head towards Major Resistances Level @ 4772.

Stock is trading above 200 days exponential moving average, suggests long term trend is bullish. EquityPandit predicts Range for the Weekly as 4772 on upside and 4390 on downside.

DR REDDY

Dr. Reddy Outlook for the Week (Mar 27, 2023 – March 31, 2023)

Prateek Gupta

Check DRREDDY Full Analysis At Unicorn Signals

DRREDDY Weekly Outlook and Analysis:

For the Week: (Mar 27, 2023 – March 31, 2023)

Dr. Reddy Outlook for the Week (Mar 27, 2023 – March 31, 2023)

BSE: 500180| NSE: DRREDDY| ISIN: INE040A01026| SECTOR: PHARMA

Stock closed the Weekly on positive note gaining 0.63%

Dr Reddy Share Price: 4464.15                

Weekly High: 4499.50

Weekly Low: 4309.20

Weekly Range: 28.00 Points

Weekly Support & Resistance For DR. Reddy:

RESISTANCE 24547
RESISTANCE 14505
SUPPORT 14415
SUPPORT 24367
Dr. Reddy Outlook for the Week (Mar 27, 2023 – March 31, 2023)

Technically on the daily charts EquityPandit’s Analyst see: Minor support on the downside lies at 4415 levels, Minor resistance on the upside is capped around 4505 levels.

If stock breaches minor support on the downside and closes below it we may see fresh break down and stock can drag towards Major Support on lower side @ 4367 and If stock breaches minor resistance on the upside and closes above it we may see fresh breakout and stock can head towards Major Resistances Level @ 4547.

Stock is trading above 200 days exponential moving average, suggests long term trend is bullish. EquityPandit predicts Range for the Weekly as 4547 on upside and 4367 on downside.

DR REDDY

Dr. Reddy Outlook for the Week (Mar 20, 2023 – March 24, 2023)

Prateek Gupta

Check DRREDDY Full Analysis At Unicorn Signals

DRREDDY Weekly Outlook and Analysis:

For the Week: (Mar 20, 2023 – March 24, 2023)

Dr. Reddy Outlook for the Week (Mar 20, 2023 – March 24, 2023)

BSE: 500180| NSE: DRREDDY| ISIN: INE040A01026| SECTOR: PHARMA

Stock closed the Weekly on positive note gaining 0.92%

Dr Reddy Share Price: 4436.15               

Weekly High: 4463.15

Weekly Low: 4309

Weekly Range: 40.60 Points

Weekly Support & Resistance For DR. Reddy:

RESISTANCE 24526
RESISTANCE 14496
SUPPORT 14342
SUPPORT 24248
Dr. Reddy Outlook for the Week (Mar 20, 2023 – March 24, 2023)

Technically on the daily charts EquityPandit’s Analyst see: Minor support on the downside lies at 4342 levels, Minor resistance on the upside is capped around 4496 levels.

If stock breaches minor support on the downside and closes below it we may see fresh break down and stock can drag towards Major Support on lower side @ 4248 and If stock breaches minor resistance on the upside and closes above it we may see fresh breakout and stock can head towards Major Resistances Level @ 4526.

Stock is trading above 200 days exponential moving average, suggests long term trend is bullish. EquityPandit predicts Range for the Weekly as 4526 on upside and 4248 on downside.

DR REDDY

Dr. Reddy Outlook for the Week (Mar 13, 2023 – March 17, 2023)

Prateek Gupta

Check DRREDDY Full Analysis At Unicorn Signals

DRREDDY Weekly Outlook and Analysis:

For the Week: (Mar 13, 2023 – March 17, 2023)

Dr. Reddy Outlook for the Week (Mar 13, 2023 – March 17, 2023)

BSE: 500180| NSE: DRREDDY| ISIN: INE040A01026| SECTOR: PHARMA

Stock closed the Weekly on negative note loosing 0.96%

Dr Reddy Share Price: 4395.55                

Weekly High: 4458.80

Weekly Low: 4350.00

Weekly Range: 42.40  Points

Weekly Support & Resistance For DR. Reddy:

RESISTANCE 24509
RESISTANCE 14452
SUPPORT 14344
SUPPORT 24293
Dr. Reddy Outlook for the Week (Mar 13, 2023 – March 17, 2023)

Technically on the daily charts EquityPandit’s Analyst see: Minor support on the downside lies at 4344 levels, Minor resistance on the upside is capped around 4452 levels.

If stock breaches minor support on the downside and closes below it we may see fresh break down and stock can drag towards Major Support on lower side @ 4293 and If stock breaches minor resistance on the upside and closes above it we may see fresh breakout and stock can head towards Major Resistances Level @ 4509.

Stock is trading on 200 days exponential moving average, suggests long term trend is nutral. EquityPandit predicts Range for the Weekly as 4509 on upside and 4293 on downside.

DR REDDY

Dr. Reddy Outlook for the Week (Jan 30, 2023 – Feb 03, 2023)

Prateek Gupta

Check DRREDDY Full Analysis At Unicorn Signals

DRREDDY Weekly Outlook and Analysis:

For the Week: (Jan 30, 2023 – Feb 03, 2023)

Dr. Reddy Outlook for the Week (Jan 30, 2023 – Feb 03, 2023)

Check DRREDDY Full Analysis At Unicorn Signals

BSE: 500180| NSE: DRREDDY| ISIN: INE040A01026| SECTOR: PHARMA

Stock closed the Weekly on negative note loosing 0.84%

Dr Reddy Share Price: 4314.00                

Weekly High: 4380.90

Weekly Low: 4175.10

Weekly Range: 36.60 Points

Weekly Support & Resistance For DR. Reddy:

RESISTANCE 24494
RESISTANCE 14404
SUPPORT 14199
SUPPORT 24084
Dr. Reddy Outlook for the Week (Jan 30, 2023 – Feb 03, 2023)

Technically on the daily charts EquityPandit’s Analyst see: Minor support on the downside lies at 4199 levels, Minor resistance on the upside is capped around 4404 levels.

If stock breaches minor support on the downside and closes below it we may see fresh break down and stock can drag towards Major Support on lower side @ 4084 and If stock breaches minor resistance on the upside and closes above it we may see fresh breakout and stock can head towards Major Resistances Level @ 4494.

Stock is trading below 200 days exponential moving average, suggests long term trend is bearish. EquityPandit predicts Range for the Weekly as 4494 on upside and 4084 on downside.

Latest
IPO
Weekly
Outlook

Stock
Market
Prediction