Finance Minister Nirmala Sitharaman, HCL Corporation CEO and Executive Director Roshni Nadar Malhotra and Biocon Founder Kiran Mazumdar Shaw have been named among 100 most powerful women of the world by Forbes. The Forbes 2019 list of ‘The World’s 100 Most Powerful Women’ has been topped by German Chancellor Angela Merkel, followed by President of the European Central Bank Christine Lagarde in the second spot and Speaker of the US House of Representatives Nancy Pelosi, ranked third. Also on the list is Bangladesh Prime Minister Sheikh Hasina (29).
In 2019, women around the globe took action, claiming leadership positions in government, business, philanthropy and media. These trailblazers are not to be messed with, Forbes said. Sitharaman, a newcomer on the Forbes most powerful women list, is ranked 34th. India’s first female finance minister, Sitharaman has also served as the country’s defence minister. According to Forbes, Mazumdar-Shaw has invested in research infrastructure and scientific talent with the aim of building a deep R&D based biotech firm, not a copycat generics maker.
Read EquityPandit’s Nifty Outlook for the Week

Dr. Reddy Outlook for the Week (April 03, 2023 – April 07, 2023)
Check DRREDDY Full Analysis At Unicorn Signals
DRREDDY Weekly Outlook and Analysis:
For the Week: (April 03, 2023 – April 07, 2023)
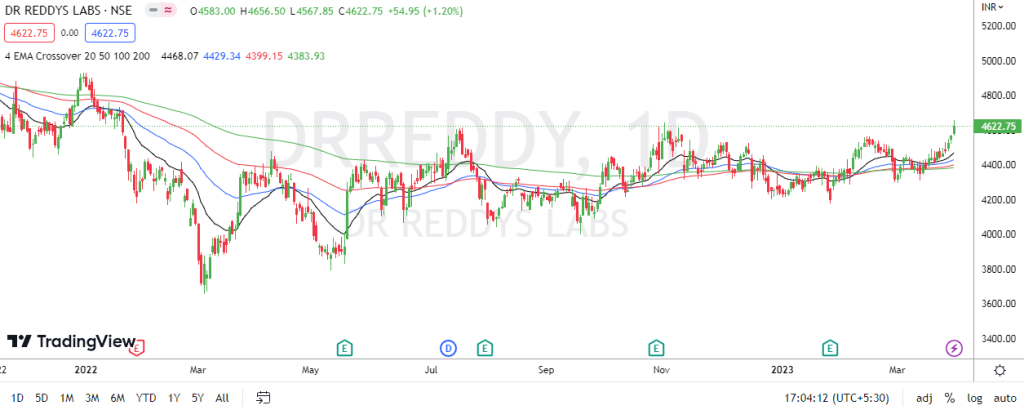
BSE: 500180| NSE: DRREDDY| ISIN: INE040A01026| SECTOR: PHARMA
Stock closed the Weekly on positive note gaining 3.55%
Dr Reddy Share Price: 4622.75
Weekly High: 4656.50
Weekly Low: 4465.05
Weekly Range: 158.60 Points
Weekly Support & Resistance For DR. Reddy:
| RESISTANCE 2 | 4772 |
| RESISTANCE 1 | 4697 |
| SUPPORT 1 | 4506 |
| SUPPORT 2 | 4390 |
Technically on the daily charts EquityPandit’s Analyst see: Minor support on the downside lies at 4506 levels, Minor resistance on the upside is capped around 4697 levels.
If stock breaches minor support on the downside and closes below it we may see fresh break down and stock can drag towards Major Support on lower side @ 4390 and If stock breaches minor resistance on the upside and closes above it we may see fresh breakout and stock can head towards Major Resistances Level @ 4772.
Stock is trading above 200 days exponential moving average, suggests long term trend is bullish. EquityPandit predicts Range for the Weekly as 4772 on upside and 4390 on downside.
Dr. Reddy Outlook for the Week (Mar 27, 2023 – March 31, 2023)
Check DRREDDY Full Analysis At Unicorn Signals
DRREDDY Weekly Outlook and Analysis:
For the Week: (Mar 27, 2023 – March 31, 2023)
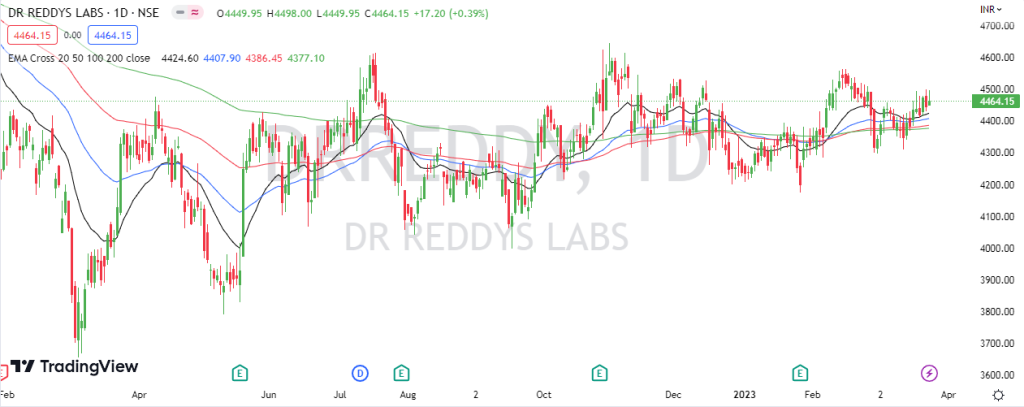
BSE: 500180| NSE: DRREDDY| ISIN: INE040A01026| SECTOR: PHARMA
Stock closed the Weekly on positive note gaining 0.63%
Dr Reddy Share Price: 4464.15
Weekly High: 4499.50
Weekly Low: 4309.20
Weekly Range: 28.00 Points
Weekly Support & Resistance For DR. Reddy:
| RESISTANCE 2 | 4547 |
| RESISTANCE 1 | 4505 |
| SUPPORT 1 | 4415 |
| SUPPORT 2 | 4367 |
Technically on the daily charts EquityPandit’s Analyst see: Minor support on the downside lies at 4415 levels, Minor resistance on the upside is capped around 4505 levels.
If stock breaches minor support on the downside and closes below it we may see fresh break down and stock can drag towards Major Support on lower side @ 4367 and If stock breaches minor resistance on the upside and closes above it we may see fresh breakout and stock can head towards Major Resistances Level @ 4547.
Stock is trading above 200 days exponential moving average, suggests long term trend is bullish. EquityPandit predicts Range for the Weekly as 4547 on upside and 4367 on downside.
Dr. Reddy Outlook for the Week (Mar 20, 2023 – March 24, 2023)
Check DRREDDY Full Analysis At Unicorn Signals
DRREDDY Weekly Outlook and Analysis:
For the Week: (Mar 20, 2023 – March 24, 2023)
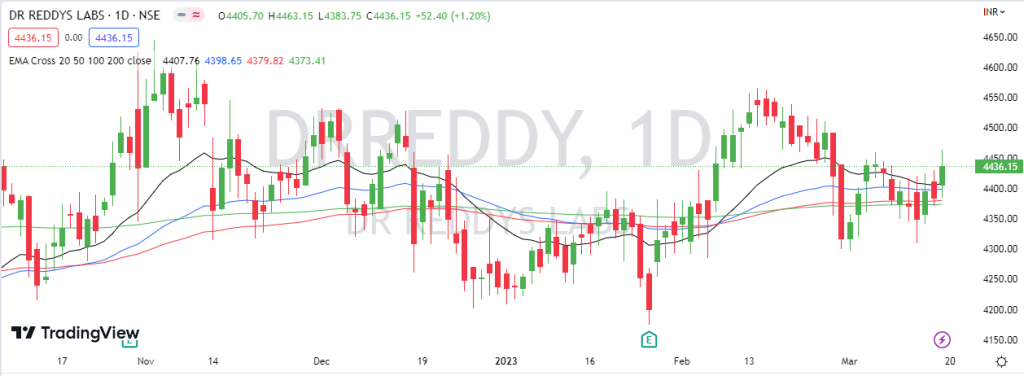
BSE: 500180| NSE: DRREDDY| ISIN: INE040A01026| SECTOR: PHARMA
Stock closed the Weekly on positive note gaining 0.92%
Dr Reddy Share Price: 4436.15
Weekly High: 4463.15
Weekly Low: 4309
Weekly Range: 40.60 Points
Weekly Support & Resistance For DR. Reddy:
| RESISTANCE 2 | 4526 |
| RESISTANCE 1 | 4496 |
| SUPPORT 1 | 4342 |
| SUPPORT 2 | 4248 |
Technically on the daily charts EquityPandit’s Analyst see: Minor support on the downside lies at 4342 levels, Minor resistance on the upside is capped around 4496 levels.
If stock breaches minor support on the downside and closes below it we may see fresh break down and stock can drag towards Major Support on lower side @ 4248 and If stock breaches minor resistance on the upside and closes above it we may see fresh breakout and stock can head towards Major Resistances Level @ 4526.
Stock is trading above 200 days exponential moving average, suggests long term trend is bullish. EquityPandit predicts Range for the Weekly as 4526 on upside and 4248 on downside.
Dr. Reddy Outlook for the Week (Mar 13, 2023 – March 17, 2023)
Check DRREDDY Full Analysis At Unicorn Signals
DRREDDY Weekly Outlook and Analysis:
For the Week: (Mar 13, 2023 – March 17, 2023)
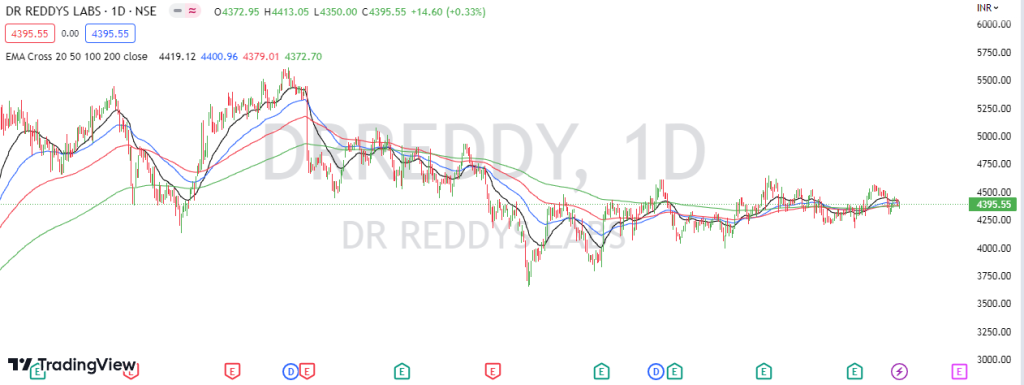
BSE: 500180| NSE: DRREDDY| ISIN: INE040A01026| SECTOR: PHARMA
Stock closed the Weekly on negative note loosing 0.96%
Dr Reddy Share Price: 4395.55
Weekly High: 4458.80
Weekly Low: 4350.00
Weekly Range: 42.40 Points
Weekly Support & Resistance For DR. Reddy:
| RESISTANCE 2 | 4509 |
| RESISTANCE 1 | 4452 |
| SUPPORT 1 | 4344 |
| SUPPORT 2 | 4293 |
Technically on the daily charts EquityPandit’s Analyst see: Minor support on the downside lies at 4344 levels, Minor resistance on the upside is capped around 4452 levels.
If stock breaches minor support on the downside and closes below it we may see fresh break down and stock can drag towards Major Support on lower side @ 4293 and If stock breaches minor resistance on the upside and closes above it we may see fresh breakout and stock can head towards Major Resistances Level @ 4509.
Stock is trading on 200 days exponential moving average, suggests long term trend is nutral. EquityPandit predicts Range for the Weekly as 4509 on upside and 4293 on downside.
Dr. Reddy Outlook for the Week (Jan 30, 2023 – Feb 03, 2023)
Check DRREDDY Full Analysis At Unicorn Signals
DRREDDY Weekly Outlook and Analysis:
For the Week: (Jan 30, 2023 – Feb 03, 2023)
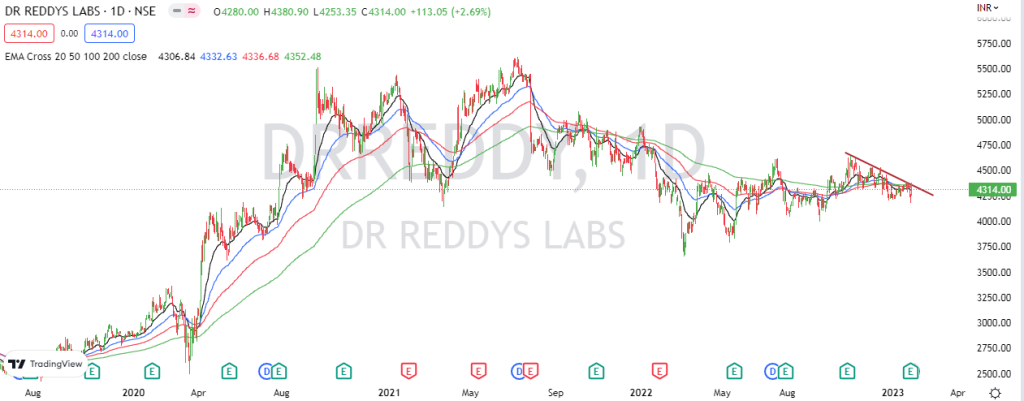
Check DRREDDY Full Analysis At Unicorn Signals
BSE: 500180| NSE: DRREDDY| ISIN: INE040A01026| SECTOR: PHARMA
Stock closed the Weekly on negative note loosing 0.84%
Dr Reddy Share Price: 4314.00
Weekly High: 4380.90
Weekly Low: 4175.10
Weekly Range: 36.60 Points
Weekly Support & Resistance For DR. Reddy:
| RESISTANCE 2 | 4494 |
| RESISTANCE 1 | 4404 |
| SUPPORT 1 | 4199 |
| SUPPORT 2 | 4084 |
Technically on the daily charts EquityPandit’s Analyst see: Minor support on the downside lies at 4199 levels, Minor resistance on the upside is capped around 4404 levels.
If stock breaches minor support on the downside and closes below it we may see fresh break down and stock can drag towards Major Support on lower side @ 4084 and If stock breaches minor resistance on the upside and closes above it we may see fresh breakout and stock can head towards Major Resistances Level @ 4494.
Stock is trading below 200 days exponential moving average, suggests long term trend is bearish. EquityPandit predicts Range for the Weekly as 4494 on upside and 4084 on downside.


