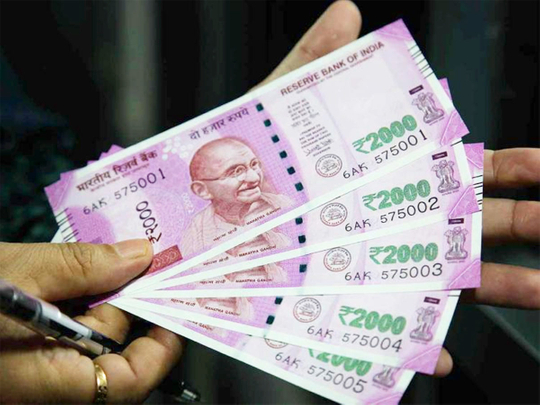
IndoSpace Core, which owns industrial and logistics parks across major cities in the country, on Wednesday said it has raised Rs 1,000 crore from HSBC to fund its existing green projects. IndoSpace Core has about 13 million square feet land across 14 industrial and logistics parks in Pune, Chennai, Bengaluru and Delhi-NCR. The company said it has closed Rs 1,000 crore green loan facility provided by The Hongkong and Shanghai Banking Corporation Limited (HSBC).
‘Proceeds from the debut green loan will be used towards the financing or refinancing of certified green projects. The green buildings have also achieved EDGE green building certification developed by the IFC, a member of the World Bank Group,’ it said.
IndoSpace Core is a joint venture between Everstone-backed warehousing and logistics specialist IndoSpace, Canada Pension Plan Investment Board (CPPIB), and global investment and fund manager GLP. IndoSpace has taken total commitment to India to above USD 3.2 billion, with a current portfolio comprising over 36 million square feet property. It is promoted by Everstone group, GLP and Realterm.
Sunil M Shah, Managing Director, Head of Multinationals, South Asia, HSBC said, ‘We are delighted to have advised IndoSpace Core on the establishment of their Green Finance Framework, and to have supported their inaugural green loan transaction.’ Also, ‘We look forward to supporting more like-minded partners like IndoSpace Core in building a sustainable future,’ Shah said.
Read EquityPandit’s Nifty Outlook for the Week
Dr. Reddy Outlook for the Week (April 03, 2023 – April 07, 2023)
Check DRREDDY Full Analysis At Unicorn Signals
DRREDDY Weekly Outlook and Analysis:
For the Week: (April 03, 2023 – April 07, 2023)
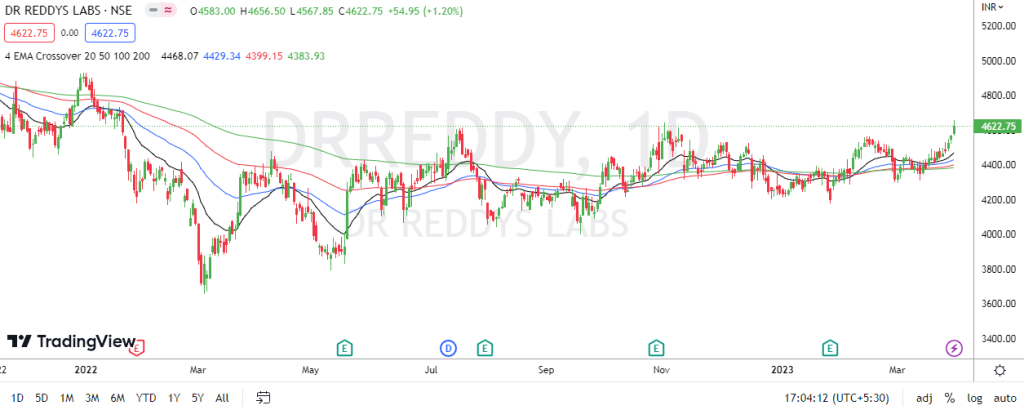
BSE: 500180| NSE: DRREDDY| ISIN: INE040A01026| SECTOR: PHARMA
Stock closed the Weekly on positive note gaining 3.55%
Dr Reddy Share Price: 4622.75
Weekly High: 4656.50
Weekly Low: 4465.05
Weekly Range: 158.60 Points
Weekly Support & Resistance For DR. Reddy:
| RESISTANCE 2 | 4772 |
| RESISTANCE 1 | 4697 |
| SUPPORT 1 | 4506 |
| SUPPORT 2 | 4390 |
Technically on the daily charts EquityPandit’s Analyst see: Minor support on the downside lies at 4506 levels, Minor resistance on the upside is capped around 4697 levels.
If stock breaches minor support on the downside and closes below it we may see fresh break down and stock can drag towards Major Support on lower side @ 4390 and If stock breaches minor resistance on the upside and closes above it we may see fresh breakout and stock can head towards Major Resistances Level @ 4772.
Stock is trading above 200 days exponential moving average, suggests long term trend is bullish. EquityPandit predicts Range for the Weekly as 4772 on upside and 4390 on downside.
Dr. Reddy Outlook for the Week (Mar 27, 2023 – March 31, 2023)
Check DRREDDY Full Analysis At Unicorn Signals
DRREDDY Weekly Outlook and Analysis:
For the Week: (Mar 27, 2023 – March 31, 2023)
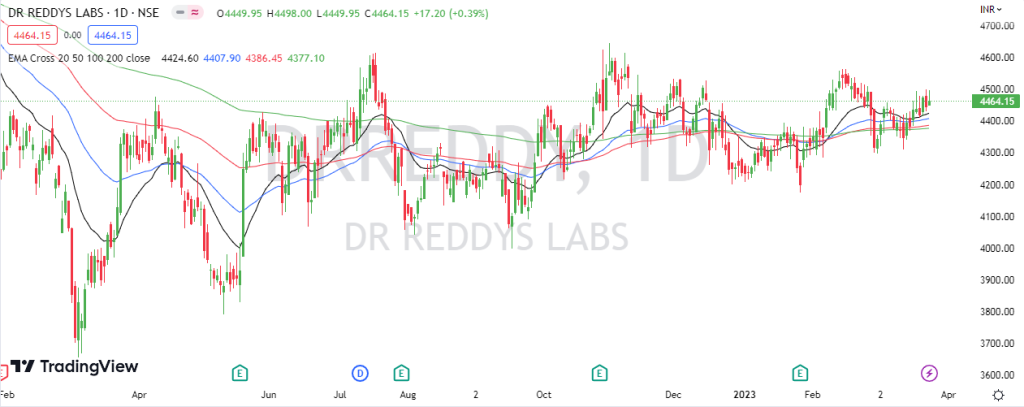
BSE: 500180| NSE: DRREDDY| ISIN: INE040A01026| SECTOR: PHARMA
Stock closed the Weekly on positive note gaining 0.63%
Dr Reddy Share Price: 4464.15
Weekly High: 4499.50
Weekly Low: 4309.20
Weekly Range: 28.00 Points
Weekly Support & Resistance For DR. Reddy:
| RESISTANCE 2 | 4547 |
| RESISTANCE 1 | 4505 |
| SUPPORT 1 | 4415 |
| SUPPORT 2 | 4367 |
Technically on the daily charts EquityPandit’s Analyst see: Minor support on the downside lies at 4415 levels, Minor resistance on the upside is capped around 4505 levels.
If stock breaches minor support on the downside and closes below it we may see fresh break down and stock can drag towards Major Support on lower side @ 4367 and If stock breaches minor resistance on the upside and closes above it we may see fresh breakout and stock can head towards Major Resistances Level @ 4547.
Stock is trading above 200 days exponential moving average, suggests long term trend is bullish. EquityPandit predicts Range for the Weekly as 4547 on upside and 4367 on downside.
Dr. Reddy Outlook for the Week (Mar 20, 2023 – March 24, 2023)
Check DRREDDY Full Analysis At Unicorn Signals
DRREDDY Weekly Outlook and Analysis:
For the Week: (Mar 20, 2023 – March 24, 2023)
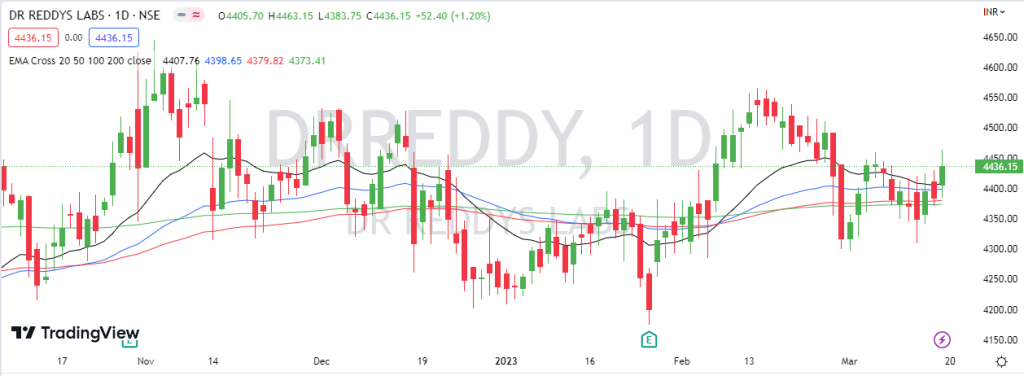
BSE: 500180| NSE: DRREDDY| ISIN: INE040A01026| SECTOR: PHARMA
Stock closed the Weekly on positive note gaining 0.92%
Dr Reddy Share Price: 4436.15
Weekly High: 4463.15
Weekly Low: 4309
Weekly Range: 40.60 Points
Weekly Support & Resistance For DR. Reddy:
| RESISTANCE 2 | 4526 |
| RESISTANCE 1 | 4496 |
| SUPPORT 1 | 4342 |
| SUPPORT 2 | 4248 |
Technically on the daily charts EquityPandit’s Analyst see: Minor support on the downside lies at 4342 levels, Minor resistance on the upside is capped around 4496 levels.
If stock breaches minor support on the downside and closes below it we may see fresh break down and stock can drag towards Major Support on lower side @ 4248 and If stock breaches minor resistance on the upside and closes above it we may see fresh breakout and stock can head towards Major Resistances Level @ 4526.
Stock is trading above 200 days exponential moving average, suggests long term trend is bullish. EquityPandit predicts Range for the Weekly as 4526 on upside and 4248 on downside.
Dr. Reddy Outlook for the Week (Mar 13, 2023 – March 17, 2023)
Check DRREDDY Full Analysis At Unicorn Signals
DRREDDY Weekly Outlook and Analysis:
For the Week: (Mar 13, 2023 – March 17, 2023)
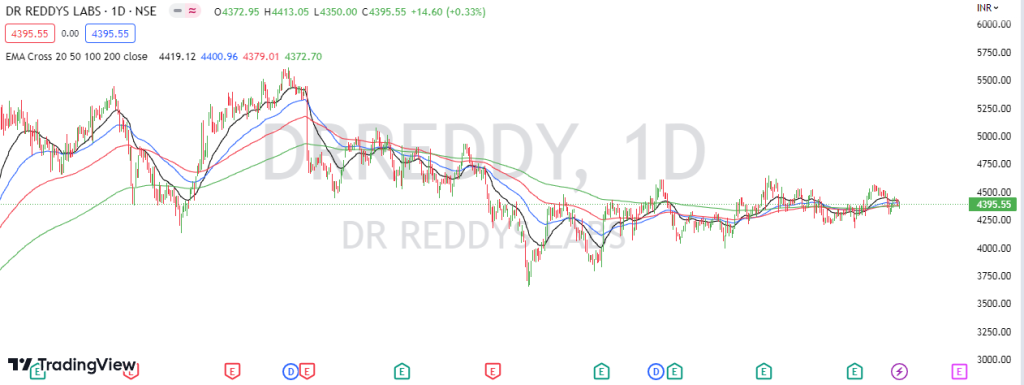
BSE: 500180| NSE: DRREDDY| ISIN: INE040A01026| SECTOR: PHARMA
Stock closed the Weekly on negative note loosing 0.96%
Dr Reddy Share Price: 4395.55
Weekly High: 4458.80
Weekly Low: 4350.00
Weekly Range: 42.40 Points
Weekly Support & Resistance For DR. Reddy:
| RESISTANCE 2 | 4509 |
| RESISTANCE 1 | 4452 |
| SUPPORT 1 | 4344 |
| SUPPORT 2 | 4293 |
Technically on the daily charts EquityPandit’s Analyst see: Minor support on the downside lies at 4344 levels, Minor resistance on the upside is capped around 4452 levels.
If stock breaches minor support on the downside and closes below it we may see fresh break down and stock can drag towards Major Support on lower side @ 4293 and If stock breaches minor resistance on the upside and closes above it we may see fresh breakout and stock can head towards Major Resistances Level @ 4509.
Stock is trading on 200 days exponential moving average, suggests long term trend is nutral. EquityPandit predicts Range for the Weekly as 4509 on upside and 4293 on downside.
Dr. Reddy Outlook for the Week (Jan 30, 2023 – Feb 03, 2023)
Check DRREDDY Full Analysis At Unicorn Signals
DRREDDY Weekly Outlook and Analysis:
For the Week: (Jan 30, 2023 – Feb 03, 2023)
Check DRREDDY Full Analysis At Unicorn Signals
BSE: 500180| NSE: DRREDDY| ISIN: INE040A01026| SECTOR: PHARMA
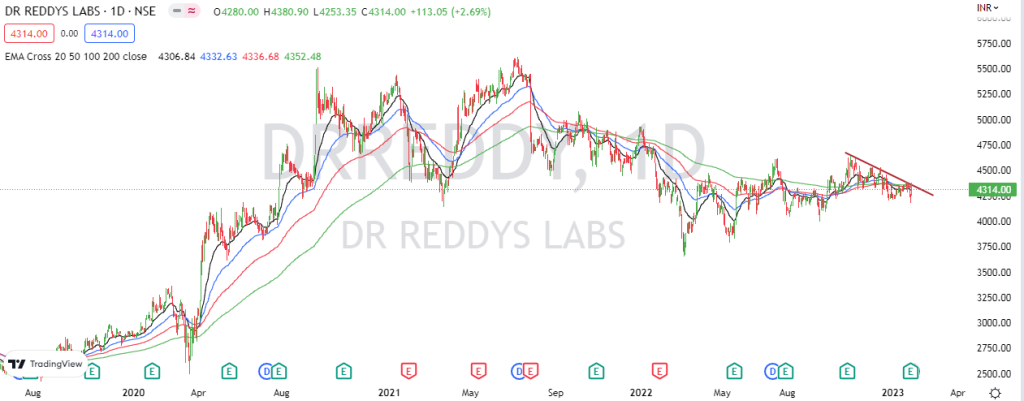
Stock closed the Weekly on negative note loosing 0.84%
Dr Reddy Share Price: 4314.00
Weekly High: 4380.90
Weekly Low: 4175.10
Weekly Range: 36.60 Points
Weekly Support & Resistance For DR. Reddy:
| RESISTANCE 2 | 4494 |
| RESISTANCE 1 | 4404 |
| SUPPORT 1 | 4199 |
| SUPPORT 2 | 4084 |
Technically on the daily charts EquityPandit’s Analyst see: Minor support on the downside lies at 4199 levels, Minor resistance on the upside is capped around 4404 levels.
If stock breaches minor support on the downside and closes below it we may see fresh break down and stock can drag towards Major Support on lower side @ 4084 and If stock breaches minor resistance on the upside and closes above it we may see fresh breakout and stock can head towards Major Resistances Level @ 4494.
Stock is trading below 200 days exponential moving average, suggests long term trend is bearish. EquityPandit predicts Range for the Weekly as 4494 on upside and 4084 on downside.


