Download Unicorn Signals App

By EquityPandit

HDFC BANK

HDFC’s Net Jumps 27% in the March Quarter, Announces Rs 17.50 Per share dividend

Mortgage lender HDFC reported an increase in the net profit of 27 percent for the March quarter. The net profit of the March quarter increased to Rs 2,861 crore as compared in the same quarter of the previous year to Rs 2256 crore. This was higher than it was estimated.
Total income of the HDFC rose to Rs 11,586.58 crore in the fourth quarter as compared to the same quarter of the previous year to Rs 9,322.36 crore. Altogether, the mortgage financier accounted net interest margin of 3.3 percent for the quarter.
The shares of HDFC traded nearly 1 percent at Rs 1,947 in noon trade. HDFC board has recommended a final dividend of Rs 17.50 per share.
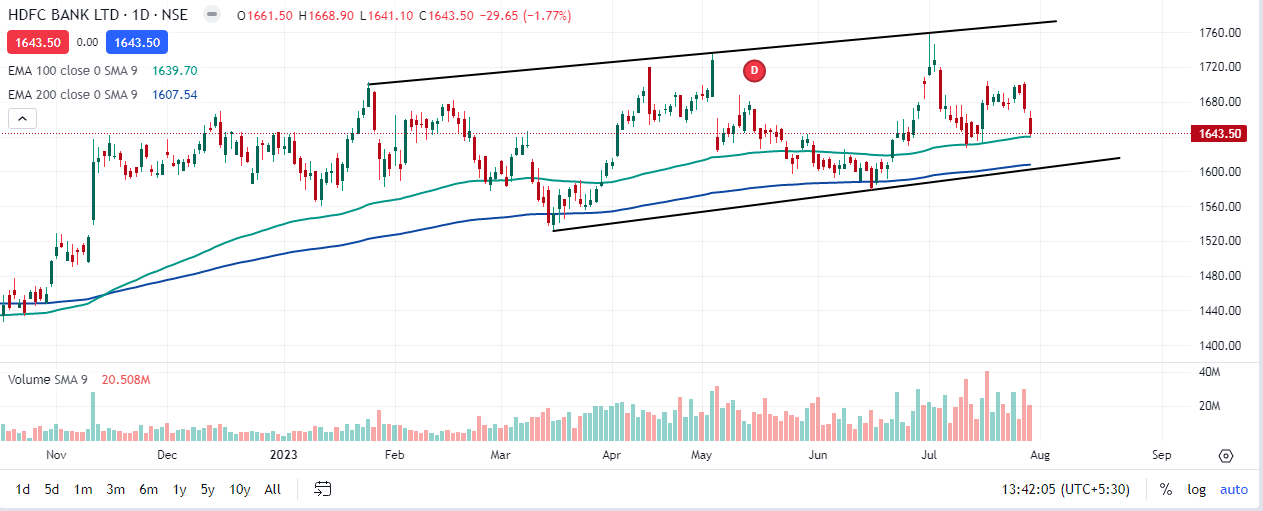
Read EquityPandit’s HDFC Bank Outlook for the Week

Get Daily Prediction & Stocks Tips On Your Mobile


I would like to receive communication from EquityPandit via sms, email, whatsapp, Google RCS for offers, updates etc.
HDFC BANK

HDFC Bank Outlook for the Week (July 31, 2023 – Aug 04, 2023)

Ali Waghbakriwala

Check HDFC Bank Full Analysis At Unicorn Signals

HDFC Bank Weekly Outlook and Analysis:

For the Week: (July 31, 2023 – Aug 04, 2023)

HDFC Bank Outlook for the Week (July 31, 2023 – Aug 04, 2023)

BSE: 500180| NSE: HDFCBANK| ISIN: INE040A01026| SECTOR: BANKS

HDFC Bank Share Price: 1643.50 (NSE)

HDFC Bank closed the Week on Negative Note losing  1.92%

Weekly High: 1703

Weekly Low: 1641.10

Weekly Range: 61.90 Points

Weekly Support & Resistance For HDFC Bank:

Technically on the daily charts EquityPandit’s Analyst see: Minor support on the downside lies at 1622 levels, Minor resistance on the upside is capped around 1684 levels.

If stock breaches minor support on the downside and closes below it we may see fresh break down and stock can drag towards Major Support on lower side @1600 and If stock breaches minor resistance on the upside and closes above it we may see fresh breakout and stock can head towards Major Resistances Level @1724

Stock is trading above 200 days exponential moving average, suggests long term trend is bullish. EquityPandit’s Predicts Range for the Weekly as 1724 on upside and 1600 on downside.

HDFC BANK

HDFC Bank Outlook for the Week (July 24, 2023 to July 28, 2023)

Ali Waghbakriwala

Check HDFC Bank Full Analysis At Unicorn Signals

HDFC Bank Weekly Outlook and Analysis:

For the Week: (July 24, 2023 – July 28, 2023)

HDFC Bank Outlook for the Week (July 24, 2023 – July 28, 2023)

 BSE: 500180| NSE: HDFCBANK| ISIN: INE040A01026| SECTOR: BANKS

HDFC Bank Share Price: 1675.75 (NSE)

HDFC Bank closed the Week on Positive Note Gaining  1.90%

Weekly High: 1704

Weekly Low: 1633

Weekly Range: 49.60 Points

Weekly Support & Resistance For HDFC Bank:

RESISTANCE 21742
RESISTANCE 11709
SUPPORT 11638
SUPPORT 21600

Technically on the daily charts EquityPandit’s Analyst see: Minor support on the downside lies at 1638 levels, Minor resistance on the upside is capped around 1709 levels.

If stock breaches minor support on the downside and closes below it we may see fresh break down and stock can drag towards Major Support on lower side @1600 and If stock breaches minor resistance on the upside and closes above it we may see fresh breakout and stock can head towards Major Resistances Level @1742

Stock is trading above 200 days exponential moving average, suggests long term trend is bullish. EquityPandit’s Predicts Range for the Weekly as 1742 on upside and 1600 on downside.

HDFC BANK

HDFC Bank Outlook for the Week (July 17, 2023 to July 21, 2023)

Ali Waghbakriwala

Check HDFC Bank Full Analysis At Unicorn Signals

HDFC Bank Weekly Outlook and Analysis:

For the Week: (July 17, 2023 – July 21, 2023)

HDFC Bank Outlook for the Week (July 17, 2023 – July 21, 2023)

BSE: 500180| NSE: HDFCBANK| ISIN: INE040A01026| SECTOR: BANKS

HDFC Bank Share Price: 1644.50 (NSE)

HDFC Bank closed the Week on Negative Note losing 0.96%

Weekly High: 1676.75

Weekly Low: 1627.15

Weekly Range: 49.60 Points

Weekly Support & Resistance For HDFC Bank:

Technically on the daily charts EquityPandit’s Analyst see: Minor support on the downside lies at 1622 levels, Minor resistance on the upside is capped around 1672 levels.

If stock breaches minor support on the downside and closes below it we may see fresh break down and stock can drag towards Major Support on lower side @1600 and If stock breaches minor resistance on the upside and closes above it we may see fresh breakout and stock can head towards Major Resistances Level @1699

Stock is trading above 200 days exponential moving average, suggests long term trend is bullish. EquityPandit’s Predicts Range for the Weekly as 1699 on upside and 1600 on downside.

HDFC BANK

HDFC Bank Outlook for the Week (10-JUL-2023 to 14-JUL-2023)

Chinmay Bohra

Check HDFC Bank Full Analysis At Unicorn Signals

HDFC Bank Weekly Outlook and Analysis:

For the Week: (July 10, 2023 – July 14, 2023)

HDFC Bank Outlook for the Week for the Week (July 10, 2023 – July 14, 2023)

BSE: 500180| NSE: HDFCBANK| ISIN: INE040A01026| SECTOR: BANKS

HDFC Bank Share Price: 1660.40 (NSE)

HDFC Bank closed the Week on Negative Note losing 2.41%

Weekly High: 1757.50

Weekly Low: 1656.30

Weekly Range: 101.20 Points

Weekly Support & Resistance For Nifty Media:

RESISTANCE 21793
RESISTANCE 11727
SUPPORT 11625
SUPPORT 21590

Technically on the daily charts EquityPandit’s Analyst see: Minor support on the downside lies at 1625 levels, Minor resistance on the upside is capped around 1727 levels.

If stock breaches minor support on the downside and closes below it we may see fresh break down and stock can drag towards Major Support on lower side @1590 and If stock breaches minor resistance on the upside and closes above it we may see fresh breakout and stock can head towards Major Resistances Level @1793

Stock is trading above 200 days exponential moving average, suggests long term trend is bullish. EquityPandit’s Predicts Range for the Weekly as 1793 on upside and 1590 on downside.

HDFC BANK

HDFC Bank Outlook for the Week (03-JUL-2023 to 07-JUL-2023)

Chinmay Bohra

Check HDFC Bank Full Analysis At Unicorn Signals

HDFC Bank Weekly Outlook and Analysis:

For the Week: (July 03, 2023 – July 07, 2023)

HDFC Bank Outlook for the Week for the Week (July 03, 2023 – July 07, 2023)

HDFC Bank closed the Week on Positive Note Gaining 3.52%

Weekly High: 1708.80

Weekly Low: 1628.70

Weekly Range: 80.10 Points

Weekly Support & Resistance For Nifty Media:

RESISTANCE 21760
RESISTANCE 11731
SUPPORT 11650
SUPPORT 21600

Technically on the daily charts EquityPandit’s Analyst see: Minor support on the downside lies at 1600 levels, Minor resistance on the upside is capped around 1731 levels.

If stock breaches minor support on the downside and closes below it we may see fresh break down and stock can drag towards Major Support on lower side @1600 and If stock breaches minor resistance on the upside and closes above it we may see fresh breakout and stock can head towards Major Resistances Level @1760

Stock is trading above 200 days exponential moving average, suggests long term trend is bullish. EquityPandit’s Predicts Range for the Weekly as 1760 on upside and 1600 on downside.

Latest
IPO
Weekly
Outlook

Stock
Market
Prediction