State-run oil marketing companies (OMC) on Tuesday announced a hike in fuel prices, after keeping rates unchanged for two straight days, according to news agency ANI. In the national capital Delhi, petrol was hiked by 25 paise a litre while an equal quantity of diesel rose by 35 paise, taking their respective rates to Rs 90.83 and Rs 81.32 for every litre.
OMCs had hiked fuel prices for 12 straight days before keeping them unchanged on February 21 and 22. On February 20, which was the last hike before the two-day pause, petrol prices were increased by 39 paise for every litre while those for diesel had gone up by 37 paise a litre, taking their respective rates to Rs 90.58 and Rs 80.97 in the city. Among the four metropolitan cities, fuel prices have been the highest in Mumbai, followed by those in Chennai, Kolkata and Delhi respectively. Rates have been high in the IT hubs of Bengaluru and Hyderabad as well.
In India, fuel prices are determined by OMCs like Indian Oil, Bharat Petroleum (BP) and Hindustan Petroleum (HP). These are fixed by taking into account fuel prices globally. Rates can be hiked, kept unchanged or pushed down. The practice of daily price revision came into effect from June 15, 207 before which prices were revised every fortnight.
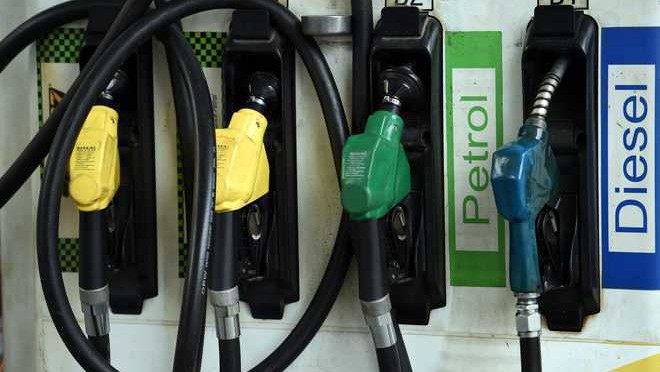
ICICI Bank Outlook for the Week (July 31, 2023 – Aug 04, 2023)
Check ICICI Bank Full Analysis At Unicorn Signals
ICICI Bank Weekly Outlook and Analysis:
For the Week: (July 31, 2023 – Aug 04, 2023)
ICICI Bank Outlook for the Week (July 31, 2023 – Aug 04, 2023)
BSE: 532174| NSE: ICICIBANK| ISIN: INE090A01021| SECTOR: BANKS
ICICIBank Share Price : 996.20 (NSE)
ICICIBank closed the Week on Negative Note losing 0.08%
Weekly High: 1008.70
Weekly Low: 977.05
Weekly Range: 30.95 Points
Weekly Support & Resistance For ICICI Bank:
RESISTANCE 2 | 1026 |
RESISTANCE 1 | 1011 |
SUPPORT 1 | 979 |
SUPPORT 2 | 962 |
Technically on the daily charts EquityPandit’s Analyst see: Minor support on the downside lies at 979 levels, Minor resistance on the upside is capped around 1011 levels.
If stock breaches minor support on the downside and closes below it we may see fresh break down and stock can drag towards Major Support on lower side @ 962 and If stock breaches minor resistance on the upside and closes above it we may see fresh breakout and stock can head towards Major Resistances Level @ 1026
Stock is trading above 200 days exponential moving average, suggests long term trend is bullish. EquityPandit’s Predicts Range for the Weekly as 1026 on upside and 962 on downside.
ICICI Bank Outlook for the Week (July 24, 2023 to July 28, 2023)
Check ICICI Bank Full Analysis At Unicorn Signals
ICICI Bank Weekly Outlook and Analysis:
For the Week: (July 24, 2023 – July 28, 2023)
ICICI Bank Outlook for the Week (July 24, 2023 – July 28, 2023)
BSE: 532174| NSE: ICICIBANK| ISIN: INE090A01021| SECTOR: BANKS
ICICIBank Share Price : 997 (NSE)
ICICIBank closed the Week on Positive Note Gaining 3.85%
Weekly High: 1001.45
Weekly Low: 952.85
Weekly Range: 23.75 Points
Weekly Support & Resistance For ICICI Bank:
RESISTANCE 2 | 1032 |
RESISTANCE 1 | 1015 |
SUPPORT 1 | 966 |
SUPPORT 2 | 935 |
Technically on the daily charts EquityPandit’s Analyst see: Minor support on the downside lies at 966 levels, Minor resistance on the upside is capped around 1015 levels.
If stock breaches minor support on the downside and closes below it we may see fresh break down and stock can drag towards Major Support on lower side @ 935 and If stock breaches minor resistance on the upside and closes above it we may see fresh breakout and stock can head towards Major Resistances Level @ 1032
Stock is trading above 200 days exponential moving average, suggests long term trend is bullish. EquityPandit’s Predicts Range for the Weekly as 1032 on upside and 935 on downside.
ICICI Bank Outlook for the Week (July 17, 2023 to July 21, 2023)
Check ICICI Bank Full Analysis At Unicorn Signals
ICICI Bank Weekly Outlook and Analysis:
For the Week: (July 17, 2023 – July 21, 2023)
ICICI Bank Outlook for the Week (July 17, 2023 – July 21, 2023)
BSE: 532174| NSE: ICICIBANK| ISIN: INE090A01021| SECTOR: BANKS
ICICIBank Share Price : 960.05 (NSE)
ICICIBank closed the Week on Positive Note Gaining 1.44%
Weekly High: 965
Weekly Low: 941.25
Weekly Range: 23.75 Points
Weekly Support & Resistance For ICICI Bank:
RESISTANCE 2 | 979 |
RESISTANCE 1 | 970 |
SUPPORT 1 | 946 |
SUPPORT 2 | 932 |
Technically on the daily charts EquityPandit’s Analyst see: Minor support on the downside lies at 946 levels, Minor resistance on the upside is capped around 970 levels.
If stock breaches minor support on the downside and closes below it we may see fresh break down and stock can drag towards Major Support on lower side @ 932 and If stock breaches minor resistance on the upside and closes above it we may see fresh breakout and stock can head towards Major Resistances Level @ 979
Stock is trading above 200 days exponential moving average, suggests long term trend is bullish. EquityPandit’s Predicts Range for the Weekly as 979 on upside and 932 on downside.
ICICI Bank Outlook for the Week (10-JUL-2023 to 14-JUL-2023)
Check ICICI Bank Full Analysis At Unicorn Signals
ICICI Bank Weekly Outlook and Analysis:
For the Week: (July 10, 2023 – July 14, 2023)
ICICI Bank Outlook for the Week for the Week (July 10, 2023 – July 14, 2023)
BSE: 532174| NSE: ICICIBANK| ISIN: INE090A01021| SECTOR: BANKS
ICICIBank Share Price : 946.40 (NSE)
ICICIBank closed the Week on Positive Note Gaining 1.26%
Weekly High: 964.75
Weekly Low: 936.50
Weekly Range: 28.25 Points
Weekly Support & Resistance For Nifty Media:
RESISTANCE 2 | 977 |
RESISTANCE 1 | 962 |
SUPPORT 1 | 934 |
SUPPORT 2 | 921 |
Technically on the daily charts EquityPandit’s Analyst see: Minor support on the downside lies at 934 levels, Minor resistance on the upside is capped around 962 levels.
If stock breaches minor support on the downside and closes below it we may see fresh break down and stock can drag towards Major Support on lower side @ 921 and If stock breaches minor resistance on the upside and closes above it we may see fresh breakout and stock can head towards Major Resistances Level @ 977
Stock is trading above 200 days exponential moving average, suggests long term trend is bullish. EquityPandit’s Predicts Range for the Weekly as 977 on upside and 921 on downside.
ICICI Bank Outlook for the Week (03-JUL-2023 to 07-JUL-2023)
Check ICICI Bank Full Analysis At Unicorn Signals
ICICI Bank Weekly Outlook and Analysis:
For the Week: (July 03, 2023 – July 07, 2023)
ICICI Bank Outlook for the Week for the Week (July 03, 2023 – July 07, 2023)
BSE: 532174| NSE: ICICIBANK| ISIN: INE090A01021| SECTOR: BANKS
ICICIBank Share Price : 934.60 (NSE)
ICICIBank closed the Week on Positive Note Gaining 1.20%
Weekly High: 944
Weekly Low: 922.2
Weekly Range: 21.80 Points
Weekly Support & Resistance For Nifty Media:
RESISTANCE 2 | 955 |
RESISTANCE 1 | 945 |
SUPPORT 1 | 923 |
SUPPORT 2 | 912 |
Technically on the daily charts EquityPandit’s Analyst see: Minor support on the downside lies at 923 levels, Minor resistance on the upside is capped around 945 levels.
If stock breaches minor support on the downside and closes below it we may see fresh break down and stock can drag towards Major Support on lower side @ 912 and If stock breaches minor resistance on the upside and closes above it we may see fresh breakout and stock can head towards Major Resistances Level @ 955
Stock is trading above 200 days exponential moving average, suggests long term trend is bullish. EquityPandit’s Predicts Range for the Weekly as 955 on upside and 912 on downside.