Download Unicorn Signals App

By EquityPandit

DR REDDY

Dr. Reddy Outlook for the Week (October 05, 2015 – October 09, 2015)

EquityPandit’s Outlook for Dr. Reddy for the week (October 05, 2015 – October 09, 2015):


DR. REDDY:


DRREDDY


Dr Reddy closed the week on positive note gaining more than 6.5%.

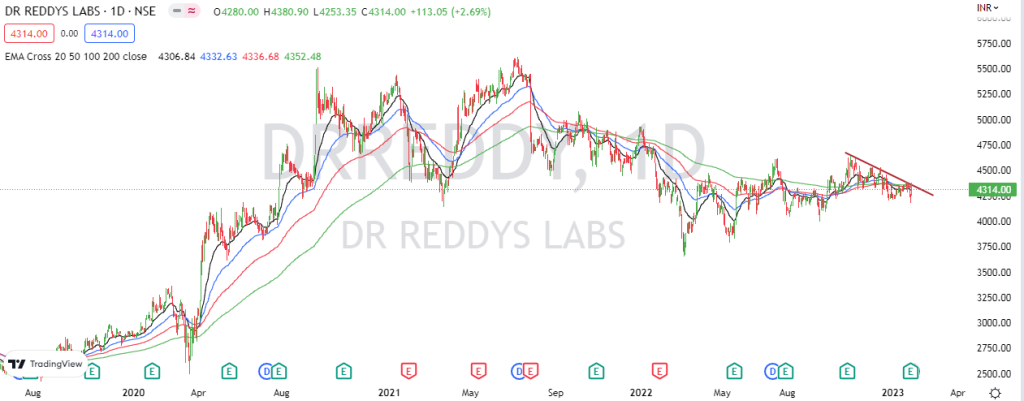
As we have mentioned last week that on daily charts the stock has formed a double bottom at around the levels of 3850. The stock is moving in the declining triangle pattern. If the stock manages to close above the declining triangle pattern positioned around the levels of 4020 then the stock can hit the targets of around 4200. During the week the stock manages to hit a high of 4250 and close the week at virtually the highest point around the levels of 4233.

Resistance for the stock lies in the range of 4290 to 4320 where trend-line joining highs is positioned. If the stock manages to move above this levels on closing basis then the stock can move to the levels of 4400.

Support for the stock lies in the range of 4100 to 4150 where short term moving averages are positioned.

The stock has formed a Hanging man pattern on monthly charts in an uptrend indicating the trend reversal. The stock has to sustain above the levels of 4310 on monthly closing basis to negate this pattern.

Broad range for the stock is seen from 4150 – 4170 on downside to 4320 – 4350 on upside.

Get Daily Prediction & Stocks Tips On Your Mobile


I would like to receive communication from EquityPandit via sms, email, whatsapp, Google RCS for offers, updates etc.
DR REDDY

Dr. Reddy Outlook for the Week (April 03, 2023 – April 07, 2023)

Prateek Gupta

Check DRREDDY Full Analysis At Unicorn Signals

DRREDDY Weekly Outlook and Analysis:

For the Week: (April 03, 2023 – April 07, 2023)

Dr. Reddy Outlook for the Week (April 03, 2023 – April 07, 2023)

BSE: 500180| NSE: DRREDDY| ISIN: INE040A01026| SECTOR: PHARMA

Stock closed the Weekly on positive note gaining 3.55%

Dr Reddy Share Price: 4622.75                 

Weekly High: 4656.50

Weekly Low: 4465.05

Weekly Range: 158.60 Points

Weekly Support & Resistance For DR. Reddy:

RESISTANCE 24772
RESISTANCE 14697
SUPPORT 14506
SUPPORT 24390
Dr. Reddy Outlook for the Week (April 03, 2023 – April 07, 2023)

Technically on the daily charts EquityPandit’s Analyst see: Minor support on the downside lies at 4506 levels, Minor resistance on the upside is capped around 4697 levels.

If stock breaches minor support on the downside and closes below it we may see fresh break down and stock can drag towards Major Support on lower side @ 4390 and If stock breaches minor resistance on the upside and closes above it we may see fresh breakout and stock can head towards Major Resistances Level @ 4772.

Stock is trading above 200 days exponential moving average, suggests long term trend is bullish. EquityPandit predicts Range for the Weekly as 4772 on upside and 4390 on downside.

DR REDDY

Dr. Reddy Outlook for the Week (Mar 27, 2023 – March 31, 2023)

Prateek Gupta

Check DRREDDY Full Analysis At Unicorn Signals

DRREDDY Weekly Outlook and Analysis:

For the Week: (Mar 27, 2023 – March 31, 2023)

Dr. Reddy Outlook for the Week (Mar 27, 2023 – March 31, 2023)

BSE: 500180| NSE: DRREDDY| ISIN: INE040A01026| SECTOR: PHARMA

Stock closed the Weekly on positive note gaining 0.63%

Dr Reddy Share Price: 4464.15                

Weekly High: 4499.50

Weekly Low: 4309.20

Weekly Range: 28.00 Points

Weekly Support & Resistance For DR. Reddy:

RESISTANCE 24547
RESISTANCE 14505
SUPPORT 14415
SUPPORT 24367
Dr. Reddy Outlook for the Week (Mar 27, 2023 – March 31, 2023)

Technically on the daily charts EquityPandit’s Analyst see: Minor support on the downside lies at 4415 levels, Minor resistance on the upside is capped around 4505 levels.

If stock breaches minor support on the downside and closes below it we may see fresh break down and stock can drag towards Major Support on lower side @ 4367 and If stock breaches minor resistance on the upside and closes above it we may see fresh breakout and stock can head towards Major Resistances Level @ 4547.

Stock is trading above 200 days exponential moving average, suggests long term trend is bullish. EquityPandit predicts Range for the Weekly as 4547 on upside and 4367 on downside.

DR REDDY

Dr. Reddy Outlook for the Week (Mar 20, 2023 – March 24, 2023)

Prateek Gupta

Check DRREDDY Full Analysis At Unicorn Signals

DRREDDY Weekly Outlook and Analysis:

For the Week: (Mar 20, 2023 – March 24, 2023)

Dr. Reddy Outlook for the Week (Mar 20, 2023 – March 24, 2023)

BSE: 500180| NSE: DRREDDY| ISIN: INE040A01026| SECTOR: PHARMA

Stock closed the Weekly on positive note gaining 0.92%

Dr Reddy Share Price: 4436.15               

Weekly High: 4463.15

Weekly Low: 4309

Weekly Range: 40.60 Points

Weekly Support & Resistance For DR. Reddy:

RESISTANCE 24526
RESISTANCE 14496
SUPPORT 14342
SUPPORT 24248
Dr. Reddy Outlook for the Week (Mar 20, 2023 – March 24, 2023)

Technically on the daily charts EquityPandit’s Analyst see: Minor support on the downside lies at 4342 levels, Minor resistance on the upside is capped around 4496 levels.

If stock breaches minor support on the downside and closes below it we may see fresh break down and stock can drag towards Major Support on lower side @ 4248 and If stock breaches minor resistance on the upside and closes above it we may see fresh breakout and stock can head towards Major Resistances Level @ 4526.

Stock is trading above 200 days exponential moving average, suggests long term trend is bullish. EquityPandit predicts Range for the Weekly as 4526 on upside and 4248 on downside.

DR REDDY

Dr. Reddy Outlook for the Week (Mar 13, 2023 – March 17, 2023)

Prateek Gupta

Check DRREDDY Full Analysis At Unicorn Signals

DRREDDY Weekly Outlook and Analysis:

For the Week: (Mar 13, 2023 – March 17, 2023)

Dr. Reddy Outlook for the Week (Mar 13, 2023 – March 17, 2023)

BSE: 500180| NSE: DRREDDY| ISIN: INE040A01026| SECTOR: PHARMA

Stock closed the Weekly on negative note loosing 0.96%

Dr Reddy Share Price: 4395.55                

Weekly High: 4458.80

Weekly Low: 4350.00

Weekly Range: 42.40  Points

Weekly Support & Resistance For DR. Reddy:

RESISTANCE 24509
RESISTANCE 14452
SUPPORT 14344
SUPPORT 24293
Dr. Reddy Outlook for the Week (Mar 13, 2023 – March 17, 2023)

Technically on the daily charts EquityPandit’s Analyst see: Minor support on the downside lies at 4344 levels, Minor resistance on the upside is capped around 4452 levels.

If stock breaches minor support on the downside and closes below it we may see fresh break down and stock can drag towards Major Support on lower side @ 4293 and If stock breaches minor resistance on the upside and closes above it we may see fresh breakout and stock can head towards Major Resistances Level @ 4509.

Stock is trading on 200 days exponential moving average, suggests long term trend is nutral. EquityPandit predicts Range for the Weekly as 4509 on upside and 4293 on downside.

DR REDDY

Dr. Reddy Outlook for the Week (Jan 30, 2023 – Feb 03, 2023)

Prateek Gupta

Check DRREDDY Full Analysis At Unicorn Signals

DRREDDY Weekly Outlook and Analysis:

For the Week: (Jan 30, 2023 – Feb 03, 2023)

Dr. Reddy Outlook for the Week (Jan 30, 2023 – Feb 03, 2023)

Check DRREDDY Full Analysis At Unicorn Signals

BSE: 500180| NSE: DRREDDY| ISIN: INE040A01026| SECTOR: PHARMA

Stock closed the Weekly on negative note loosing 0.84%

Dr Reddy Share Price: 4314.00                

Weekly High: 4380.90

Weekly Low: 4175.10

Weekly Range: 36.60 Points

Weekly Support & Resistance For DR. Reddy:

RESISTANCE 24494
RESISTANCE 14404
SUPPORT 14199
SUPPORT 24084
Dr. Reddy Outlook for the Week (Jan 30, 2023 – Feb 03, 2023)

Technically on the daily charts EquityPandit’s Analyst see: Minor support on the downside lies at 4199 levels, Minor resistance on the upside is capped around 4404 levels.

If stock breaches minor support on the downside and closes below it we may see fresh break down and stock can drag towards Major Support on lower side @ 4084 and If stock breaches minor resistance on the upside and closes above it we may see fresh breakout and stock can head towards Major Resistances Level @ 4494.

Stock is trading below 200 days exponential moving average, suggests long term trend is bearish. EquityPandit predicts Range for the Weekly as 4494 on upside and 4084 on downside.

Latest
IPO
Weekly
Outlook

Stock
Market
Prediction