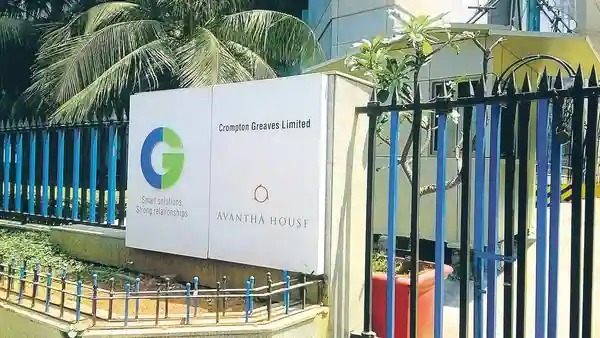
CG Power and Industrial Solutions came under pressure on March 2 but recovered in late trading to end down 2%. Overall, it is a downtrend, especially after hitting an all-time high of Rs 338.60 on February 14.
The stock was down more than 5% intraday, especially in afternoon trade, and touched an intraday low of Rs 291, roughly in line with the 50% Fib retracement level of Rs 293 been in place since January this year — the lowest intraday level since 27.
Usually, the 50% Fib retracement level acts as a support level for normal trading, and if it is broken, more corrections are possible.
The stock closed down 2.2% at Rs 300 on a late trading recovery but managed to hold on to its February 28 low of Rs 298.8. It has formed a bearish candlestick pattern like the bearish engulfing pattern on the daily bar chart, which is a negative sign.
Hence, if the stock finds support around Rs 290, a rebound is likely, but a decisive break above that level could drag the stock below the 100-day SMA (Exponential Moving Average – Rs 284), experts said.
After hitting a lifetime high this February, CG Power formed a shooting star candlestick on the monthly chart. However, the stock broke out of the previous month’s low, suggesting that profit-taking had occurred at higher levels.
 Live
Live

