Abbott India Ltd
NSE :ABBOTINDIA BSE :500488 Sector : Pharmaceuticals
About Company: Abbott India is engaged in the business of manufacturing, selling, distribution and marketing of Pharmaceuticals.
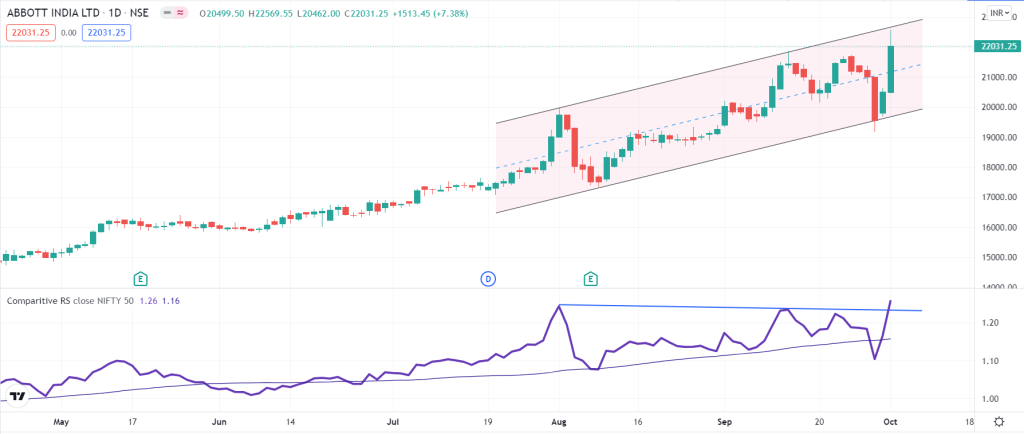
Daily Chart of Abbott India Limited:

Technical Outlook of Abbott India Limited:
Pharma Stock Abbott India Outperformed all other Pharma Stocks on Friday’s 1th Oct 2021 trade. Closed with gains of 10% on NSE. Stock is a new candidate in the Future and options segment. If we look at the chart setup and chart structure stock is trading in uptrend. Comparative Relative Strength (CRS) shows outperformance and momentum in the stock.
As from the above chart one can observe stock is trading in a channel pattern, Channel resistance lies at 22700- 22750, if stock manages to cross 22750 and sustains above it we may see another leg of rally in the stock.
We recommend buying stock once it sustains above 22750, possible targets can be 23700 – 30500 in the next few trading sessions. Stop loss should be maintained below 21700 on a closing basis.
 Live
Live
