In Wednesday’s trade, DHFL surged nearly 4 per cent on reports that lenders will consider the housing finance company and were ready to accept limited haircuts in a restructuring plan being worked out for the distressed firm.
Following the report, the scrip surged 3.65 per cent to hit a high of Rs 52.45 on BSE.
On Saturday, he country’s fourth largest Housing Finance Company met lenders and other debt holders last week to discuss the outline of a rescue package. Earlier the same firm has warned that its financial situation was tight and business had to earth to a stop,
But analyst experts say the firm may thrash to find buyers for the businesses it wants to sell or attract other investors to raise to Rs 7,000 crore in extra equity that DHFL wants.
Meanwhile, DHFL will be excluded from the equity derivatives segment on the NSE from September 27.
Read EquityPandit’s Nifty Outlook for the Week

Dr. Reddy Outlook for the Week (April 03, 2023 – April 07, 2023)
Check DRREDDY Full Analysis At Unicorn Signals
DRREDDY Weekly Outlook and Analysis:
For the Week: (April 03, 2023 – April 07, 2023)
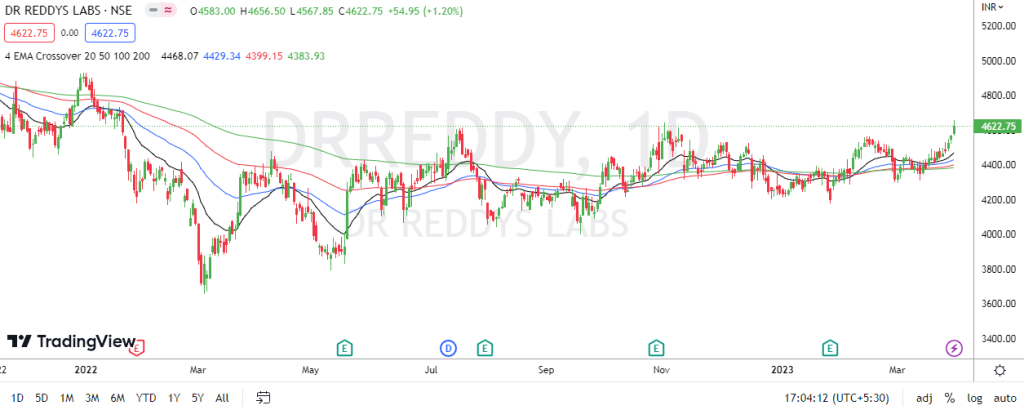
BSE: 500180| NSE: DRREDDY| ISIN: INE040A01026| SECTOR: PHARMA
Stock closed the Weekly on positive note gaining 3.55%
Dr Reddy Share Price: 4622.75
Weekly High: 4656.50
Weekly Low: 4465.05
Weekly Range: 158.60 Points
Weekly Support & Resistance For DR. Reddy:
| RESISTANCE 2 | 4772 |
| RESISTANCE 1 | 4697 |
| SUPPORT 1 | 4506 |
| SUPPORT 2 | 4390 |
Technically on the daily charts EquityPandit’s Analyst see: Minor support on the downside lies at 4506 levels, Minor resistance on the upside is capped around 4697 levels.
If stock breaches minor support on the downside and closes below it we may see fresh break down and stock can drag towards Major Support on lower side @ 4390 and If stock breaches minor resistance on the upside and closes above it we may see fresh breakout and stock can head towards Major Resistances Level @ 4772.
Stock is trading above 200 days exponential moving average, suggests long term trend is bullish. EquityPandit predicts Range for the Weekly as 4772 on upside and 4390 on downside.
Dr. Reddy Outlook for the Week (Mar 27, 2023 – March 31, 2023)
Check DRREDDY Full Analysis At Unicorn Signals
DRREDDY Weekly Outlook and Analysis:
For the Week: (Mar 27, 2023 – March 31, 2023)
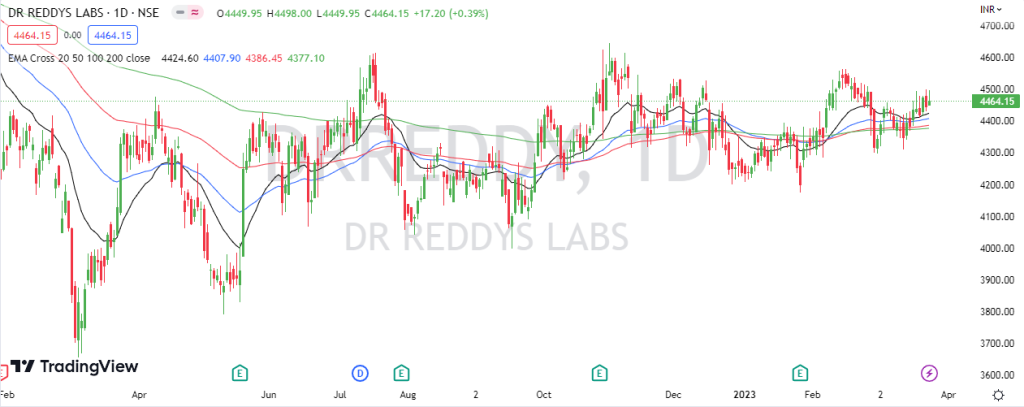
BSE: 500180| NSE: DRREDDY| ISIN: INE040A01026| SECTOR: PHARMA
Stock closed the Weekly on positive note gaining 0.63%
Dr Reddy Share Price: 4464.15
Weekly High: 4499.50
Weekly Low: 4309.20
Weekly Range: 28.00 Points
Weekly Support & Resistance For DR. Reddy:
| RESISTANCE 2 | 4547 |
| RESISTANCE 1 | 4505 |
| SUPPORT 1 | 4415 |
| SUPPORT 2 | 4367 |
Technically on the daily charts EquityPandit’s Analyst see: Minor support on the downside lies at 4415 levels, Minor resistance on the upside is capped around 4505 levels.
If stock breaches minor support on the downside and closes below it we may see fresh break down and stock can drag towards Major Support on lower side @ 4367 and If stock breaches minor resistance on the upside and closes above it we may see fresh breakout and stock can head towards Major Resistances Level @ 4547.
Stock is trading above 200 days exponential moving average, suggests long term trend is bullish. EquityPandit predicts Range for the Weekly as 4547 on upside and 4367 on downside.
Dr. Reddy Outlook for the Week (Mar 20, 2023 – March 24, 2023)
Check DRREDDY Full Analysis At Unicorn Signals
DRREDDY Weekly Outlook and Analysis:
For the Week: (Mar 20, 2023 – March 24, 2023)
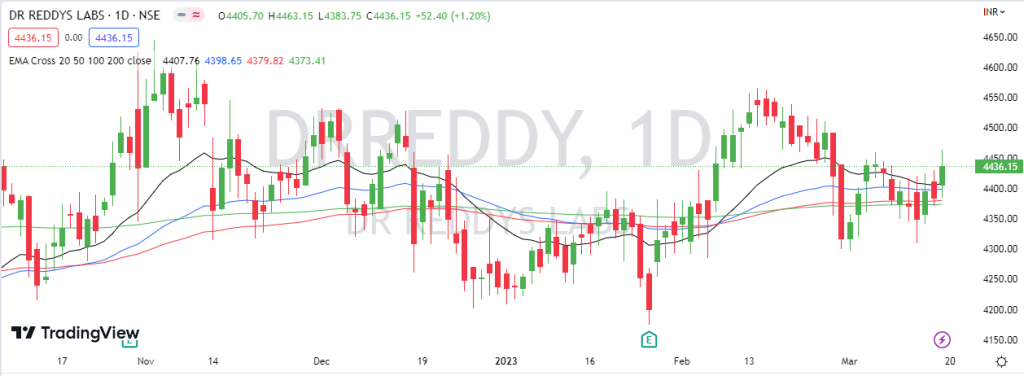
BSE: 500180| NSE: DRREDDY| ISIN: INE040A01026| SECTOR: PHARMA
Stock closed the Weekly on positive note gaining 0.92%
Dr Reddy Share Price: 4436.15
Weekly High: 4463.15
Weekly Low: 4309
Weekly Range: 40.60 Points
Weekly Support & Resistance For DR. Reddy:
| RESISTANCE 2 | 4526 |
| RESISTANCE 1 | 4496 |
| SUPPORT 1 | 4342 |
| SUPPORT 2 | 4248 |
Technically on the daily charts EquityPandit’s Analyst see: Minor support on the downside lies at 4342 levels, Minor resistance on the upside is capped around 4496 levels.
If stock breaches minor support on the downside and closes below it we may see fresh break down and stock can drag towards Major Support on lower side @ 4248 and If stock breaches minor resistance on the upside and closes above it we may see fresh breakout and stock can head towards Major Resistances Level @ 4526.
Stock is trading above 200 days exponential moving average, suggests long term trend is bullish. EquityPandit predicts Range for the Weekly as 4526 on upside and 4248 on downside.
Dr. Reddy Outlook for the Week (Mar 13, 2023 – March 17, 2023)
Check DRREDDY Full Analysis At Unicorn Signals
DRREDDY Weekly Outlook and Analysis:
For the Week: (Mar 13, 2023 – March 17, 2023)
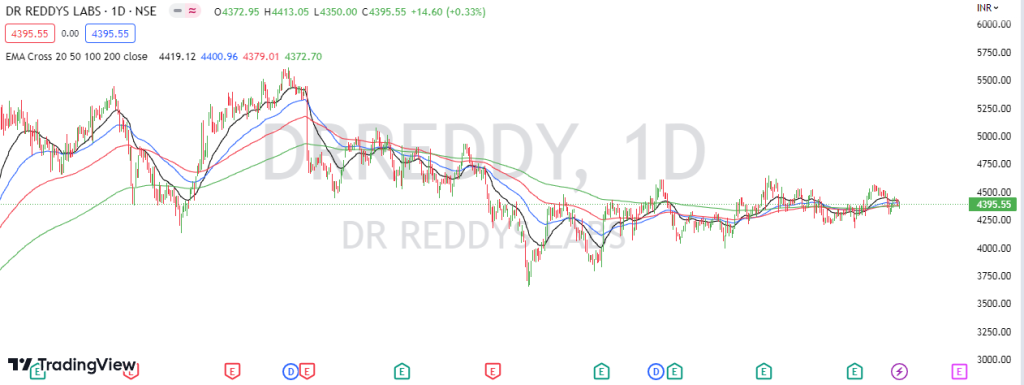
BSE: 500180| NSE: DRREDDY| ISIN: INE040A01026| SECTOR: PHARMA
Stock closed the Weekly on negative note loosing 0.96%
Dr Reddy Share Price: 4395.55
Weekly High: 4458.80
Weekly Low: 4350.00
Weekly Range: 42.40 Points
Weekly Support & Resistance For DR. Reddy:
| RESISTANCE 2 | 4509 |
| RESISTANCE 1 | 4452 |
| SUPPORT 1 | 4344 |
| SUPPORT 2 | 4293 |
Technically on the daily charts EquityPandit’s Analyst see: Minor support on the downside lies at 4344 levels, Minor resistance on the upside is capped around 4452 levels.
If stock breaches minor support on the downside and closes below it we may see fresh break down and stock can drag towards Major Support on lower side @ 4293 and If stock breaches minor resistance on the upside and closes above it we may see fresh breakout and stock can head towards Major Resistances Level @ 4509.
Stock is trading on 200 days exponential moving average, suggests long term trend is nutral. EquityPandit predicts Range for the Weekly as 4509 on upside and 4293 on downside.
Dr. Reddy Outlook for the Week (Jan 30, 2023 – Feb 03, 2023)
Check DRREDDY Full Analysis At Unicorn Signals
DRREDDY Weekly Outlook and Analysis:
For the Week: (Jan 30, 2023 – Feb 03, 2023)
Check DRREDDY Full Analysis At Unicorn Signals
BSE: 500180| NSE: DRREDDY| ISIN: INE040A01026| SECTOR: PHARMA
Stock closed the Weekly on negative note loosing 0.84%
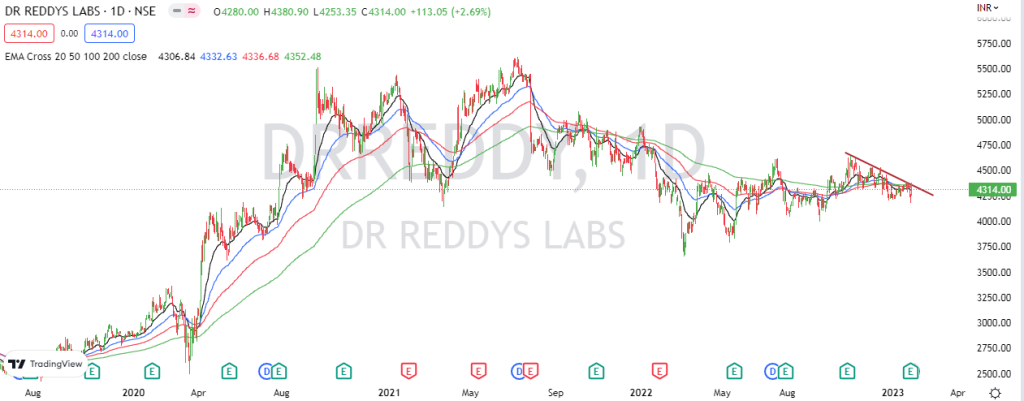
Dr Reddy Share Price: 4314.00
Weekly High: 4380.90
Weekly Low: 4175.10
Weekly Range: 36.60 Points
Weekly Support & Resistance For DR. Reddy:
| RESISTANCE 2 | 4494 |
| RESISTANCE 1 | 4404 |
| SUPPORT 1 | 4199 |
| SUPPORT 2 | 4084 |
Technically on the daily charts EquityPandit’s Analyst see: Minor support on the downside lies at 4199 levels, Minor resistance on the upside is capped around 4404 levels.
If stock breaches minor support on the downside and closes below it we may see fresh break down and stock can drag towards Major Support on lower side @ 4084 and If stock breaches minor resistance on the upside and closes above it we may see fresh breakout and stock can head towards Major Resistances Level @ 4494.
Stock is trading below 200 days exponential moving average, suggests long term trend is bearish. EquityPandit predicts Range for the Weekly as 4494 on upside and 4084 on downside.


