In the previous session,the Nifty Index has once again attempted to test its key resistance level of 15900.The Nifty index saw a flat opening in the morning and traded in the range bound. However, in the last hour the Index made high near 15893 levels and ended the day with a net gain of 61.40 points.Technically, the Index formed a bullish candle on the chart and closed above the 20 DMA support . As long as the Nifty Index does not move above 15900 level convincingly, we recommend continuing to approach the markets in a stock-specific way.
Look at the below research report of ‘Stocks to Buy for – Thursday, July 08, 2021’ before the market opens.
IndusInd Bank Ltd

NSE :INDUSINDBK BSE :532187 Sector : Banks
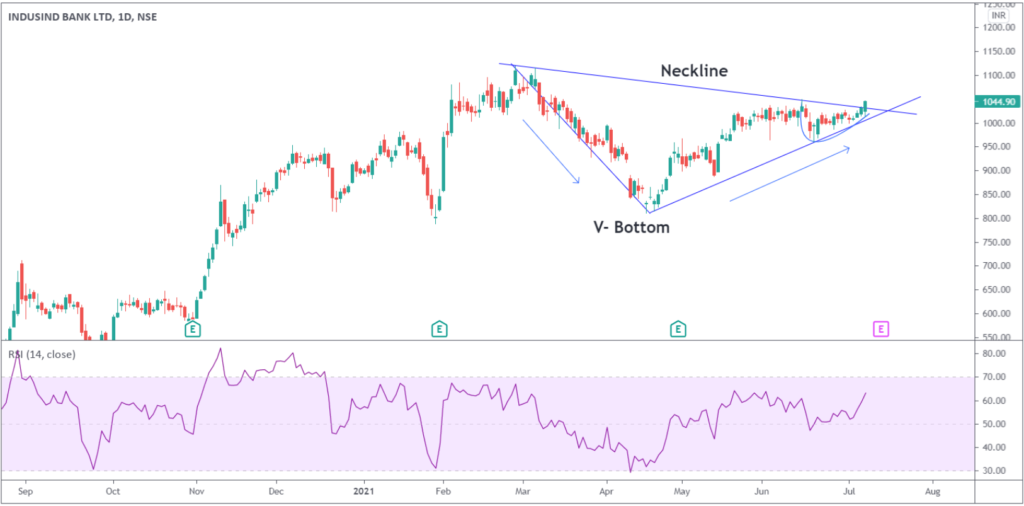
On the daily chart, we can see that INDUSIND BANK stock formed a ‘V- Bottom pattern’ and closed above the neckline of the pattern.The V-Pattern is a powerful reversal pattern seen in all time-frames. It must have a sharp downtrend followed by a quick and sharp uptrend reversal.In the daily time frame of INDUSIND BANK, we witnessed a sudden price fall near 811 levels and then a complete retracement of the bearish movement after that. Buying confirmation was made with the help of 14 days RSI which is currently placed near 63.28, indicates bullishness.
In a nutshell, the short-term trend of INDUSIND BANK is positive. To continue with the up move, a break above 1050 levels is required. If we take projection of Fibonacci retracement then there is a possibility of seeing the target of 1120 levels as long as 1002 levels hold on the downside.
Check More Analysis on INDUSINDBANK at: IndusInd Bank Ltd


